Gradient
Selected Phase-sensitive HMQC
Differences between HSQC and HMQC
Similiar to 1H-13C HSQC, HMQC reveals through-bond correlations between 1H
and one-bond connected heteronucleus such as 13C. The differences between the
two experiments are: (1) HSQC sequence involves more pulses, potentially making
pulse calibration more important, and (2) more significantly, the HMQC spectrum
also shows through-bond 1H-1H couplings along the indirect (13C) dimension
because both 1H and 13C are in the XY plane during 13C evolution. In a HSQC,
the 1H-1H couplings are absent because all 1H's are along Z-axis during the
single quantum 13C coherencee evolution. These 1H-1H couplings are often small
and only obvious when the resolution is good along the indirect dimension. But
some peak broadening along the 13C dimension is expected in a HMQC.
Becuase the HMQC sequence retains the 1H-1H coupling along the 13C
dimension, the splitting of the peaks along 13C dimension can be used to
estimate a major 1H-1H coupling constant if shaprness allows an accurate
measurement. However, several couplings may be involved, leading to a complex
peak profile and rendering this method less useful in measuring 1H-1H J
couplings in many situations.
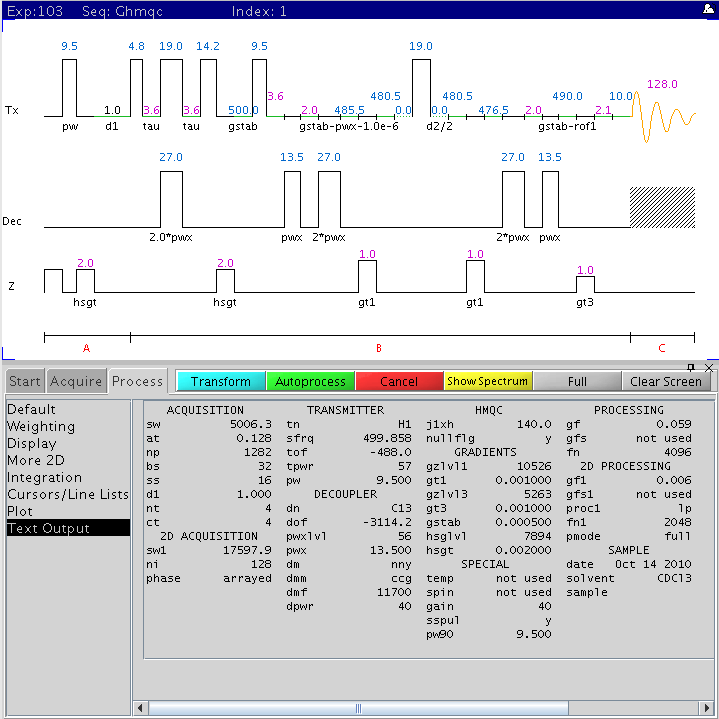
The following figure is the gradient based 2D 1H-13C HMQC pulse sequence
with the main parameters displayed (NMR500).
Procedure (on NMR500)
- Temperature must be regulated. Currently FTS is used to regulate
temperature. temp control in vnmrJ is turned off. Check VT operation procedure here if VT experiments are to be
done.
- Turn spin OFF.
- Gradients amplifier should be turned on (displays RUN).
Check the box sitting on the console. If front control button is on
Standby, flip it to ON.
- Type pfgon='nny' su to allow gradient pulses.
- Lock and shim your sample as usual. Keep lock at ~70-80% after
shimming.
- Find proper sw and tof to use
- Under exp1 (type jexp1 to go
there), collect a standard 1H spectrum (nt=1 is Ok for this, but 4 gives
cleaner spectrum)
- Put the box cursor to enclose the signal region
and to include ~10% flat baseline area at each end of the peak region. Type
movesw. This command sets a new spectral width
sw and spectrum center tof.
- Re-collect a 1D 1H spectrum with the new setting.
Type wft f full. Reference the 1H spectrum carefully.
- Load standard HMQC data file
- Join a different experiment (i.e.
jexp2 or create it with cexp(2) if it
doesn't exist).
- From exp2, type mf(1,2) to move
fid from exp1 to exp2. Type wft f full to display
spectrum. Check reference.
- Type setexp('ghmqc')
su to load standard ghmqc parameters. Solvent, and 1H
spectral width and center are copied over from 1D spectrum.
- Tune 1H and X channels. Accuracy of pre-calibrated pw
depends on probe tuning.
- Recable the X nucleus probe input cable.
- Disconnect the X nucleus cable at the filters in
front of the broadband preamp (left side). Connect the X-channel probe
input cable to one end of the long, 13C bandpass filter (labeled 13C on
filter) on the floor. Connect the other end of the filter to the X-channel
decoupler cable coming from the back of the magnet leg interface (long,
tall box to the right of the magnet).
- Re-shim Z1 and Z2 a bit after this cabling
change.
- Check/set proper 1H transmitter power and pulse width. If solvent is
CDCL3,use default values. For other solvents, calibrate pw according to this procedure.
- Use default parameters values (~20 mins experiment) except the
following:
- pw=XXX pw90=pw
(value calibrated with your solvent at tpwr=57)
- Optionally, for better quality data (may results
in longer data collection time):
- ss=32 (more dummy scans before
data collection)
- nt=8 (or 16, 24, ... 4*n) for
more sensitivity and less artifacts
- ni=256 (better resolution along
indirect dimension)
- d1=2 (for less artifacts and
sensitivity, but doubles data collection time)
- Type time to check experiment time.
- Type go to collect data.
- Watch for ADC or receiver overflow:
- In arrayed experiments such as 2D's, a fixed
gain (not autogain) must be set. Watch the receiver overflow light and the
ADC overflow error message immediately after the experiment starts. If the
receiver overflows (red light blinks on VT display) or ADC overflow message
is seen above the command area anytime during the experiment except during
the dummy scan period, it is likely the data are ruined. Stop the
experiment and reduce gain by 2-4 at a time until the overflow disappears.
The default (gain=36) works most of the time unless there
is an extremely strong 1H signal in your sample. With a gain above 20, it
makes only small differences.
- After the experiment is done, recable the X (decoupler) channel
connection to the original configuration.
Default parameters
The default setting (modified from Varian's default values) in our parameter
set uses the following for a quick 2D experiment:
- ni=128 (128 complex points along indirect dimension. For
better resolution, set ni bigger, ie.
ni=256)
- d1=1 (recycle delay between scans is 1 sec)
- ss=16 (16 dummy scans before actual data collection)
- nt=4 (4 scans)
- phase=1,2 (phase-sensitive mode in indirect
detection)
- gain=36 (reduce it by 2 at a time if receiver or ADC
overflows)
- sspul='y' (spin randomization with homospoil gradients
before recycle delay turned on)
Data Processing
You can use vnmrJ to process the data, but vnmrJ's graphics display for 2D
spectrum leaves much to be desired. A separate program is strongly recommended
for detailed processing and analysis.
One of the most widely used free processing/display software package for
multi-dimensional NMR data processing is nmrPipe/nmrDraw. This
program package has been installed on NMR500 and the data station. Follow this procedure to process data with nmrPipe/nmrDraw.
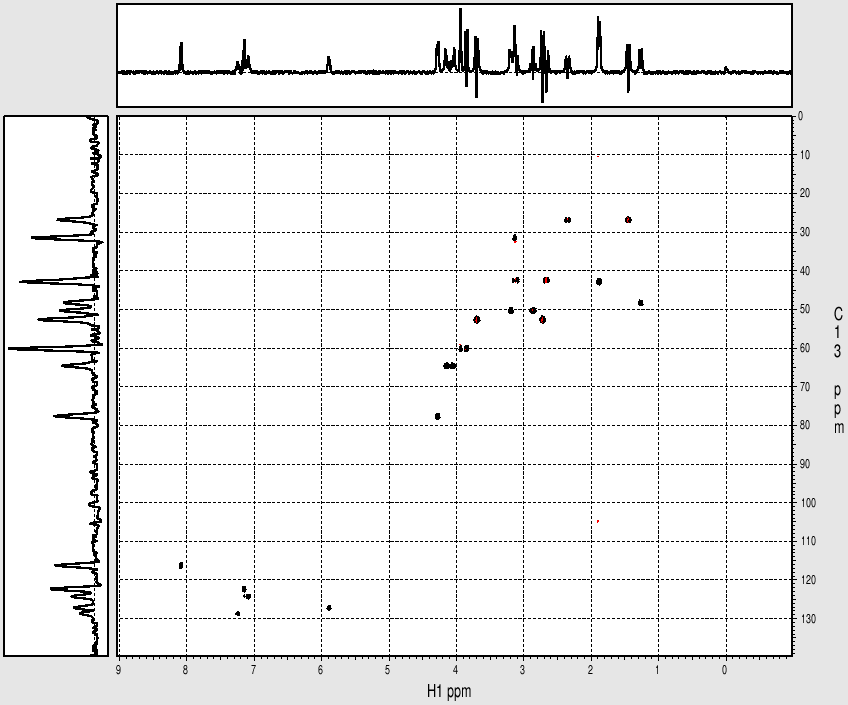
Example spectrum collected on NMR500
- Data collected October 2010 (~20 mins)
- Processed and displayed with nmrPipe/nmrDraw
- Phase-senitive mode
Sample: Strychnine at ~ 25mg/mL (~ 100mM) in cdcl3
- Data collected October 2010 (~20 mins with nt=4)
- Processed and displayed with nmrPipe/nmrDraw
|
 |
Strychnine
1H-13C gHMQC
H. Zhou
Updated Oct 2010