Cyclenoe
Cyclenoe is a traditional, steady-state NOESY experiment
implemented by Varian. The experiment uses on- and off-resonance saturation to
give a difference spectrum where NOE peaks are revealed and phased positive and
the saturated peak phased negative. The selective saturation can be optionally
done with a frequency cycling scheme where the saturation frequency shifts
between multiplet peaks. The %NOE is calculated as the integral ratio of the
NOE peak over that of the saturation peak. Note that this sequence is not the
best sequence to use for qualitative estimate of NOEs in structural and
conformational analysis due to its complex setup procedure and artifacts in the
spectrum. It is the sequence to use only when traditional quantitative %NOE is
needed.
Cyclenoe is one of the trickiest experiments to set up in order to get a
clean spectrum due to a number of factors, including hardware stability and
parameter settings. Besides the spectrometer and probe stability the recycle
delay (d1) and saturation time (sattime)
settings may have a big impact on the cleanness of the difference spectrum and
the accuracy of the %NOE measurement. Therefore, measuring T1 values for
cyclenoe is an important requirement.
The following is a procedure for setting up a cyclenoe experiment, using a
test run with a strychnine sample as an example.
Procedure
In the following, go to Process->Text Output to see
text/parameter display. To list the experiment library, type
explib. To create a new experiment, type
cexp(n) where n is an experiment that does not exist. All
parameters will be copied over from the current experiment to the new one. Type
jexp(n) to join exp #n.
Step 1:
- Spin must be turned off
- Lock and shim Z1, Z2. Adjust X1 and Y1 a bit, and re-shim Z1 and Z2.
- Lock sample at ~ 70-80%.
Step 2: Collect 1H spectrum & set spectral window
- Join exp1 (jexp1, or another exp #). Collect a standard
1H spectrum with nt=1 (or nt=4 for
cleaner spectrum)
- Put the box cursor to enclose the signal region and to include ~10% flat
baseline area at both ends of the signal region. Type
movesw . This sets a new spectral width
sw and spectrum center tof .
- Run another 1H spectrum with nt=1 with the new setting.
Phase and reference the spectrum carefully.
Step 3: Estimate Longest T1 (Optional, but highly recommended for data
quality)
In order to choose the right duration of d1 and
sattime, T1 values of your compound should be measured.
Failure to do so compromises the accuracy of the %NOE measurement and may
introduce artifacts in the spectrum.
- Join exp2 (or another experiment #) with jexp2. Type
mf(1,2) to move FID from exp1 to exp2. Type wft f
full to display spectrum.
- Type setexp('t1h'). Enter the following parameters at
the prompt:
- Minimum T1 expected (sec): enter ~0.5
- Maximum T1 expected (sec): enter your estimate
(~ 5 for a typical non-degassed sample)
- Number of scans: enter 1 (or multiple of 4)
- After the input, the program sets up a recycle
delay (d1) to 4*max_T1, and displays an array of
relaxation delays (d2). Type go to start
data collection.
- As data are being collected, click Autoprocess to
process it. If manual processing is needed, type wft ds(1) f
full to display the 1st array element (d2=0). Phase this spectrum
to negative signal. If you phase it to the normal positive signal, type
rp=rp+180 to change it to all negative. Type
dssa to display a stack plot, vs=vs*0.5
dssa dscale to halve peak height and re-display
array with scale.
- See figure below. Each peak may have a different T1 value, reflected as
different d2 points where the peak turns from negative to positive (around
a null, or no signal point). The null point is needed for an estimate of
T1. Look for the peak from your compound that crosses the null point the
latest in the array (longest d2 delays). In the following figure, this peak
is at ~8.1ppm and the null point is ~ #7 from the bottom, corresponding to
d2 of 2 sec. Interpolate between two points if possible to get better
estimate of the null point. Write down this value
(d2_null).
- Calculate longest T1:
- The longest T1 should be calculated as:
T1_max=d2_null/0.69
Example:
d2 (relaxation delay) is set to 11 elements varying from 0
to 32 seconds appearing from bottom to top in the stack plot (see text field in
figure below for array values). On the far right is the TMS 0ppm signal. The
longest T1 in strychnine appears for the peak at ~ 8.1ppm.
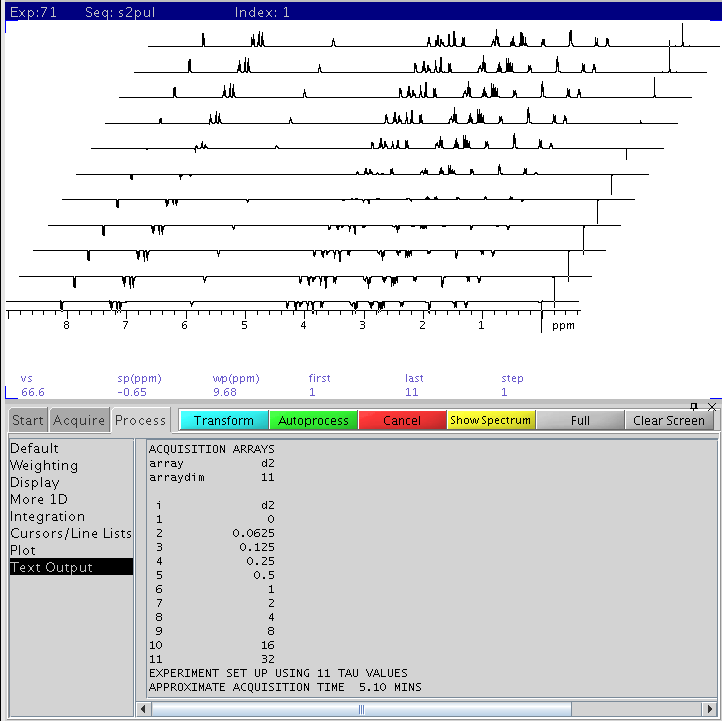
The index of the null crossing point for the 8.1ppm peak is #7 from the
bottom, corresponding to a d2 of 2 sec. The T1 value of this
1H is:
- T1=d2_null/0.69=2.0/0.69=2.9 sec
Step 4: Find on- and off- resonance saturation frequencies
- Type jexp(1) wft f full to go to the 1H spectrum
collected in Step 2. Type dn='H1' to set
the 1st decoupler nucleus to H1. Zoom in and locate the peak to saturate.
- First, put single cursor red line at the center of the peak(s),
a singlet or a multiplet. Type sd. Write down the
dof value (satfrq) printed above the
command line.
- Next, put the single cursor in an empty region
near the peak(s) to be saturated. Keep the separation of this position and
the excitation peak > 0.5ppm. Type sd. Write down this
dof value (control).
- Next, if the saturation peak is a single peak,
jump to Step 5. If the peak is a multiplet, put box
cursors (double red lines) centered on the outer peaks in the multiplet. Keep the box
symmetric around the center. Type delta?. Write down this
value.
Step 5: Set up CYCLENOE
Do CYCLENOE under another experiment, here exp3. To create exp3 if it doesn't exist, enter cexp(3). To go to (or join) exp3, enter
jexp(3). To find out how long the exp takes, enter time.
- Join exp3 (or another experiment) with jexp3. Type
mf(1,3) wft f full to copy H1 spectrum from exp1 to exp3.
- Type setexp('cyclenoe')
- Go to Process->Text Output to see parameter list. Change the following
parameters (type dg to refresh parameter list):
- satfrq= set to value found
above
- control= set to value found
above
- pattern= set this to the number
of peaks in the multiplet. For singlet, pattern=1. For doublet, pattern=2.
For triplet, pattern=3, etc.
- spacing= 0 (zero) if pattern=1.
If pattern > 1, set this to the spacing in Hz between adjacent peaks in
the multiplet. Calculate it as spacing=delta/(pattern-1). Alternatively,
you can measure the peak separation with the box cursors. Put left and
right cursor centered at two adjacent peaks in the multiplet and type
delta? This is spacing.
- sattime= ~
3*T1_max found above, otherwise use default. See this comparison for details on possible
artifacts with long sattime.
- d1= ~5*T1_max
found above, otherwise use default, but keep it to 20 sec max for faster
experiment.
- satpwr=-16 (negative 16) in
most cases when using frequency cycling for multiplet peaks (default). For
singlet peak, if peak is broad, use a bit higher power up to -10.
- nt= multiple of 32 for
intsub='y' (internal subtraction, default).
- Use default values for other parameters
- Type go to collect data
- After every 4 scans, type wft to process data. The full
phase-cycle is 32. DO NOT abort experiment unless it has
accumulated muliple of 32 scans.
- Manually phase spectrum with saturation peak
pointing down (negative) and NOE peak(s) pointing up. Do not use aph. Type
lp=0 to remove any baseline rolling and re-phase the
negative peak.
- To move spectrum up to window center, type
vp=vp+50 or vp=50 (or 70, 100 etc.)
What to do with single broad peak?
The choice is (1) to use a single, centered radiation frequency and a higher
power (satpwr), or (2) to divide the peak into frequency bins
(as in a multiplet peak) and use frequency cycling within the bins at minimum
power (satpwr=-16). The 2nd choice might be better (but it
also depends on other factors) because at the lowest power the selectivity is
better and the saturation is more uniform within the broad peak. To use the 2nd
method, in Step 4:
- Find satfrq with the same method mentioned above
- Next, put the box cursor evenly around the broad peak to enclose the peak
at ~10-20% height. There is no need to enclose the entire peak at the
base.
- Type delta? To divide this peak into 5 bins, set
pattern=5 spacing=delta/(pattern-1).
Example:
| Sample: Strychnine 25mg/mL in CDCL3
Date: October 17, 2010 on NMR500
Experiment time: 14 mins
|
 |
The following parameters are used (Default values after
setexp command, unless changed by users):
- Temperature regulated at: 22C
- Spin is turned OFF
- intsub='y' (internal subtraction of on- and
off-resonance saturation spectra. No separate spectra are
retained.)
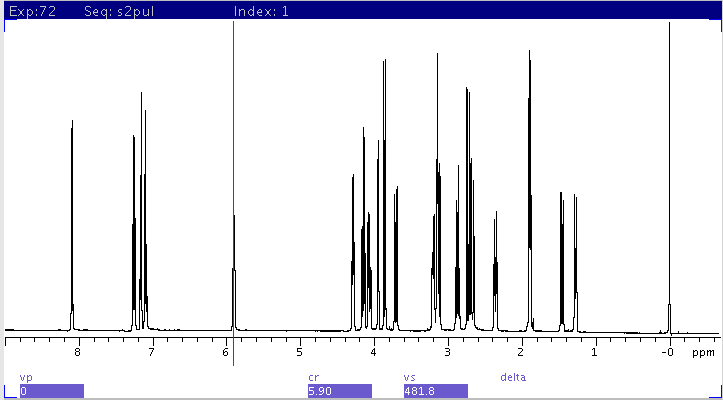
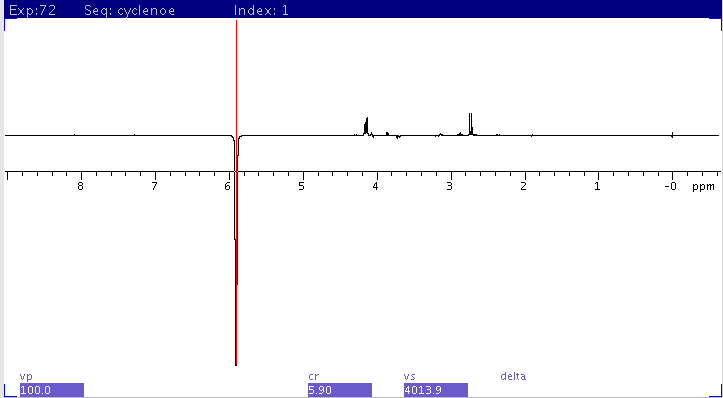
- satfrq (on-resonance selective saturation) is set to
triplet peak at 5.90ppm
- control (off-resonance selective saturation position) is
set to ~ 5.00ppm
- cycle='y' (uses frequency cycling during
saturation)
- spacing=13.5 (spacing between multiplet in Hz,
measured)
- pattern=3 (multiplet pattern is set to 3 for
triplet)
- d1=16 (16 seconds recycle delay)
- sattime=8 (8 seconds saturation)
- tau=0.1 (time in sec spent on irradiation of single peak
in multiplet during frequency cycling, default)
- satpwr= -16 (minimal power)
- mix=0 (mixing time, not used)
- sspul='y' (trim pulses before d1),
default
- nt=32 (multiple of 32 if intsub='y'.)
- bs=4 (block size 4, save data for processing every 4
scans)
- at=2.5 (2.5 sec acquisition time)
- lb=0.5 (line-broadening with wft is 0.5 Hz)
- ss=0 (no dummy scans)
1H spectrum
CYCLENOE with
1H saturation set to 5.9ppm
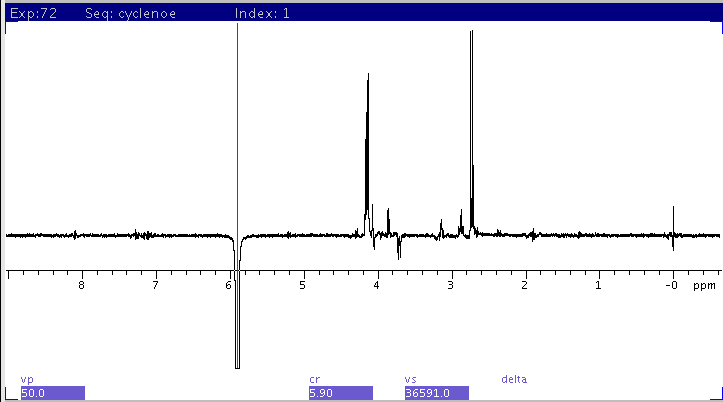
scaled to fit
window
H. Zhou
updated June 2017