- Data collected October 2010 (~ 5 mins with nt=1)
T1 or longitudinal relaxation time is the time constant of the exponential relaxation process for spins to return to the equilibrium state along Z from a non-equilibrium state. This value varies between different protons in the molecule, depending on its surrounding atoms, bonding, and local and global dynamics. Paramagnetic ions in the sample may drastically change T1, often shortening it. Degassing a sample of small molecules (where the paramagnetic O2 is removed) typically increases T1. Practically, T1 values directly affect signal sensitivity and integration accuracy in fast 1-pulse experiments as discussed here, and also have an strong impact on the quality and accuracy of CYCLENOE (%NOE) measurement. Although it is not necessary to measure T1 values of every sample, it is important to keep in mind the impact of this variable parameter on certain quantitative experiment measurements and the ways to minimize its effects.
In the following, go to Process->Text Output to see text/parameter display. To list the experiment library, type explib. To create a new experiment, type cexp(n) where n is an experiment that does not exist. All parameters will be copied over from the current experiment to the new one. Type jexp(n) to join exp #n.
Note: T1 measurement has a wide range of experiment time, from a few mins for a non-degassed concentrated sample, to hours for a degassed dilute sample. The main macro used here, setexp('t1h'), is modified from Varian's dot1 macro.
Step 4: Optional: Detailed fitting of T1 values (See T1 table below)
Sample: Strychnine at ~ 25mg/mL (~ 100mM) in cdcl3
|
|
d2 (relaxation delay) is set to 11 elements varying from 0 to 32 seconds appearing from bottom to top in the stack plot (see text field in figure below for array values). On the far right is the TMS 0ppm signal. The longest T1 in strychnine appears for the peak at ~ 8.1ppm.
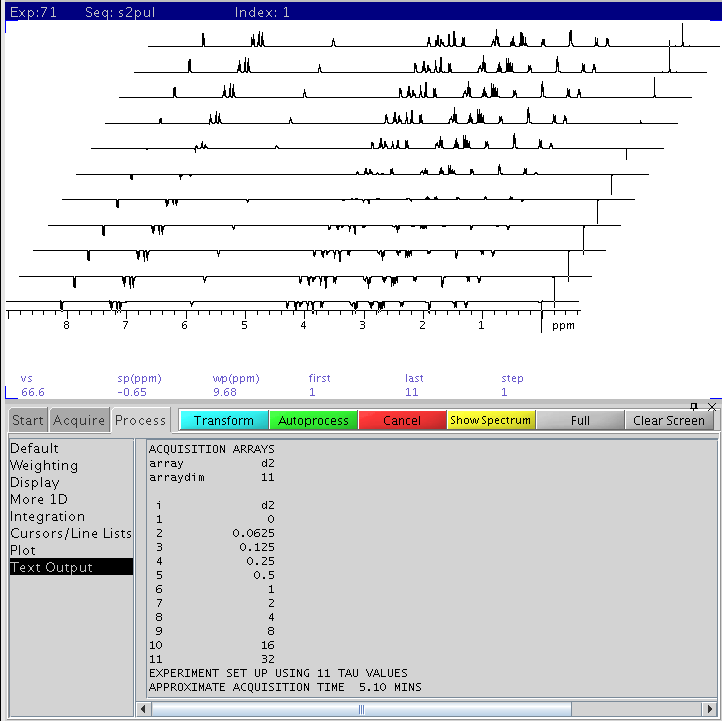
The index of the null crossing point for the 8.1ppm peak is #7 from the bottom, corresponding to a d2 of 2 sec. The setimated T1 value of this 1H is:
The more accurate value, extracted through an exponential fitting, is 3.67 sec (see table below).
T1min ~ 0.52 sec. T1max ~ 3.67 sec
| Peak Index | Peak PPM | T1 (sec) | Uncertainty (sec) |
| 1 | 8.10216 | 3.675 | 0.2665 |
| 2 | 8.08622 | 3.63 | 0.1616 |
| 3** | 7.27592 | 8.591 | 0.8691 |
| 4 | 7.27061 | 2.828 | 0.2117 |
| 5 | 7.26824 | 2.482 | 0.1406 |
| 6 | 7.25348 | 2.265 | 0.125 |
| 7 | 7.23753 | 2.164 | 0.1005 |
| 8 | 7.16843 | 1.647 | 0.1201 |
| 9 | 7.15367 | 1.713 | 0.07301 |
| 10 | 7.10996 | 2.095 | 0.1402 |
| 11 | 7.0952 | 2.167 | 0.11 |
| 12 | 7.07984 | 2.13 | 0.04203 |
| 13 | 5.90102 | 1.817 | 0.1042 |
| 14 | 4.3005 | 1.134 | 0.06235 |
| 15 | 4.29401 | 1.127 | 0.0405 |
| 16 | 4.28751 | 1.127 | 0.05556 |
| 17 | 4.28456 | 1.087 | 0.0784 |
| 18 | 4.27747 | 1.088 | 0.07076 |
| 19 | 4.27097 | 1.093 | 0.05687 |
| 20 | 4.1688 | 0.8389 | 0.03495 |
| 21 | 4.15463 | 0.8232 | 0.03953 |
| 22 | 4.14104 | 0.7744 | 0.03844 |
| 23 | 4.12746 | 0.7797 | 0.02982 |
| 24 | 4.08257 | 0.6757 | 0.03265 |
| 25 | 4.07076 | 0.6668 | 0.03759 |
| 26 | 4.05541 | 0.6334 | 0.04381 |
| 27 | 4.043 | 0.6371 | 0.041 |
| 28 | 3.94615 | 1.335 | 0.07579 |
| 29 | 3.86878 | 1.453 | 0.07239 |
| 30 | 3.84752 | 1.502 | 0.05516 |
| 31 | 3.72113 | 0.6836 | 0.02965 |
| 32 | 3.6916 | 0.672 | 0.04287 |
| 33 | 3.21794 | 0.6636 | 0.0259 |
| 34 | 3.21322 | 0.712 | 0.02809 |
| 35 | 3.2079 | 0.7372 | 0.03002 |
| 36 | 3.19905 | 0.6981 | 0.04113 |
| 37 | 3.19078 | 0.7317 | 0.02781 |
| 38 | 3.18251 | 0.6999 | 0.04901 |
| 39 | 3.1577 | 0.8789 | 0.03441 |
| 40 | 3.14117 | 1.031 | 0.05386 |
| 41 | 3.12286 | 0.8595 | 0.05201 |
| 42 | 3.10632 | 0.8306 | 0.0389 |
| 43 | 2.90079 | 0.5316 | 0.02843 |
| 44 | 2.88012 | 0.5552 | 0.0345 |
| 45 | 2.86241 | 0.5485 | 0.02592 |
| 46 | 2.84351 | 0.5353 | 0.02728 |
| 47 | 2.74429 | 0.6285 | 0.02806 |
| 48 | 2.71476 | 0.6297 | 0.02706 |
| 49 | 2.69172 | 0.8202 | 0.02963 |
| 50 | 2.68464 | 0.8564 | 0.03447 |
| 51 | 2.65688 | 0.8483 | 0.03334 |
| 52 | 2.65038 | 0.864 | 0.05475 |
| 53 | 2.38048 | 0.5284 | 0.01943 |
| 54 | 2.37221 | 0.5276 | 0.0162 |
| 55 | 2.36335 | 0.5417 | 0.02828 |
| 56 | 2.35213 | 0.5557 | 0.02442 |
| 57 | 2.34327 | 0.5381 | 0.0316 |
| 58 | 2.335 | 0.5524 | 0.0544 |
| 59 | 1.90446 | 0.6484 | 0.02012 |
| 60 | 1.89619 | 0.6672 | 0.03134 |
| 61 | 1.88556 | 0.6721 | 0.03328 |
| 62 | 1.87493 | 0.7234 | 0.07359 |
| 63 | 1.47096 | 0.539 | 0.01987 |
| 64 | 1.44203 | 0.5607 | 0.02737 |
| 65 | 1.29024 | 1.16 | 0.03404 |
| 66 | 1.28434 | 1.202 | 0.05118 |
| 67 | 1.27784 | 1.231 | 0.08796 |
| 68 | 1.26957 | 1.262 | 0.06103 |
| 69 | 1.26308 | 1.254 | 0.06905 |
| 70 | 1.25717 | 1.305 | 0.1476 |
| 71*** | 0.00865212 | 2.751 | 0.9253 |
| 72*** | 0.00215558 | 5.674 | 0.1518 |
***TMS reference peak at 0.0ppm
H. Zhou updated Nov 2010