 |
 |
Adding Spectra From Separate Data Collections
Sometimes it is necessary to accumulate and add up the same type of data from separate data collections with the same or separate samples for the following reasons: (1) instrument time constraint or insufficient prior accumulation, (2) separate samples of the same molecules have to be used because the molecules are unstable, or (3) the chemical reaction reaches completion before acceptable signal-to-noise ratios (SNRs) can be obtained during in situ reaction monitoring.While it is possible to add new scans to an existing FID, this method is risky because gain from direct addition of FIDs in the time-domain relies on several identical factors over the periods of separate data collections, especially tuning, phase stability over time. Both can change and affect the phase of the signal which may lead to cancellation rather than addition of the signals in the FIDs from separate runs. Temperature variations or other changes that shift peaks or change peak lineshapes between different runs are also harder to deal with when FIDs are added directly.
A safer way is to simply run separate experiments with one or more samples as usual, but add the spectra after processing in the frequency domain where there is a chance to adjust each spectrum before adding them. The following illustrates how this can be easily done in Mnova for 1D spectra. This method works for 2D data as well. Here I have collected a series of directly detected 15N spectra using the same sample, with varying number of scans, recycle delays or pulse width for a different testing purpose. In principle, this can be done with separate samples.
To avoid complications during data processing, it is important to keep the spectral width and acquisition time the same. Most importantly, make sure the data size (number of points) after FT is the same for each spectrum and adjust any small resonance shifting as needed before adding them. Furthermore, note that (1) integration accuracy won't change if individual spectra are done properly, and (2) ideally all spectra should be scaled to a similar noise level for optimal noise cancellation before adding them up, especially when SNRs differ substantially bewteen the spectra. The scaling can be done under Stack menu in Mnova. Mnova has an "autoscale" button but this seems to scale the maximum peaks to the same height, not the noises to the same level. Manual adjustment is needed. See a comparision with and without noise scaling below.
Process individual spectrum
First, FT, phase and baseline-correct each spectrum. Check the number of data points in the spectrum under Processing→Zero Filling and LP to make sure all spectra have the same number of points. Also check that the peaks align well between the spectra. This is best done with the spectra displayed in the "superimposed" mode under Stacked→Mode. If there is a relative shift, you can adjust the shifting under Stack→Stacked→Adjust Stacked Items. Alternatively, you may also fine-adjust the chemical shift referencing of each spectrum before stacking them.Create spectrum stack
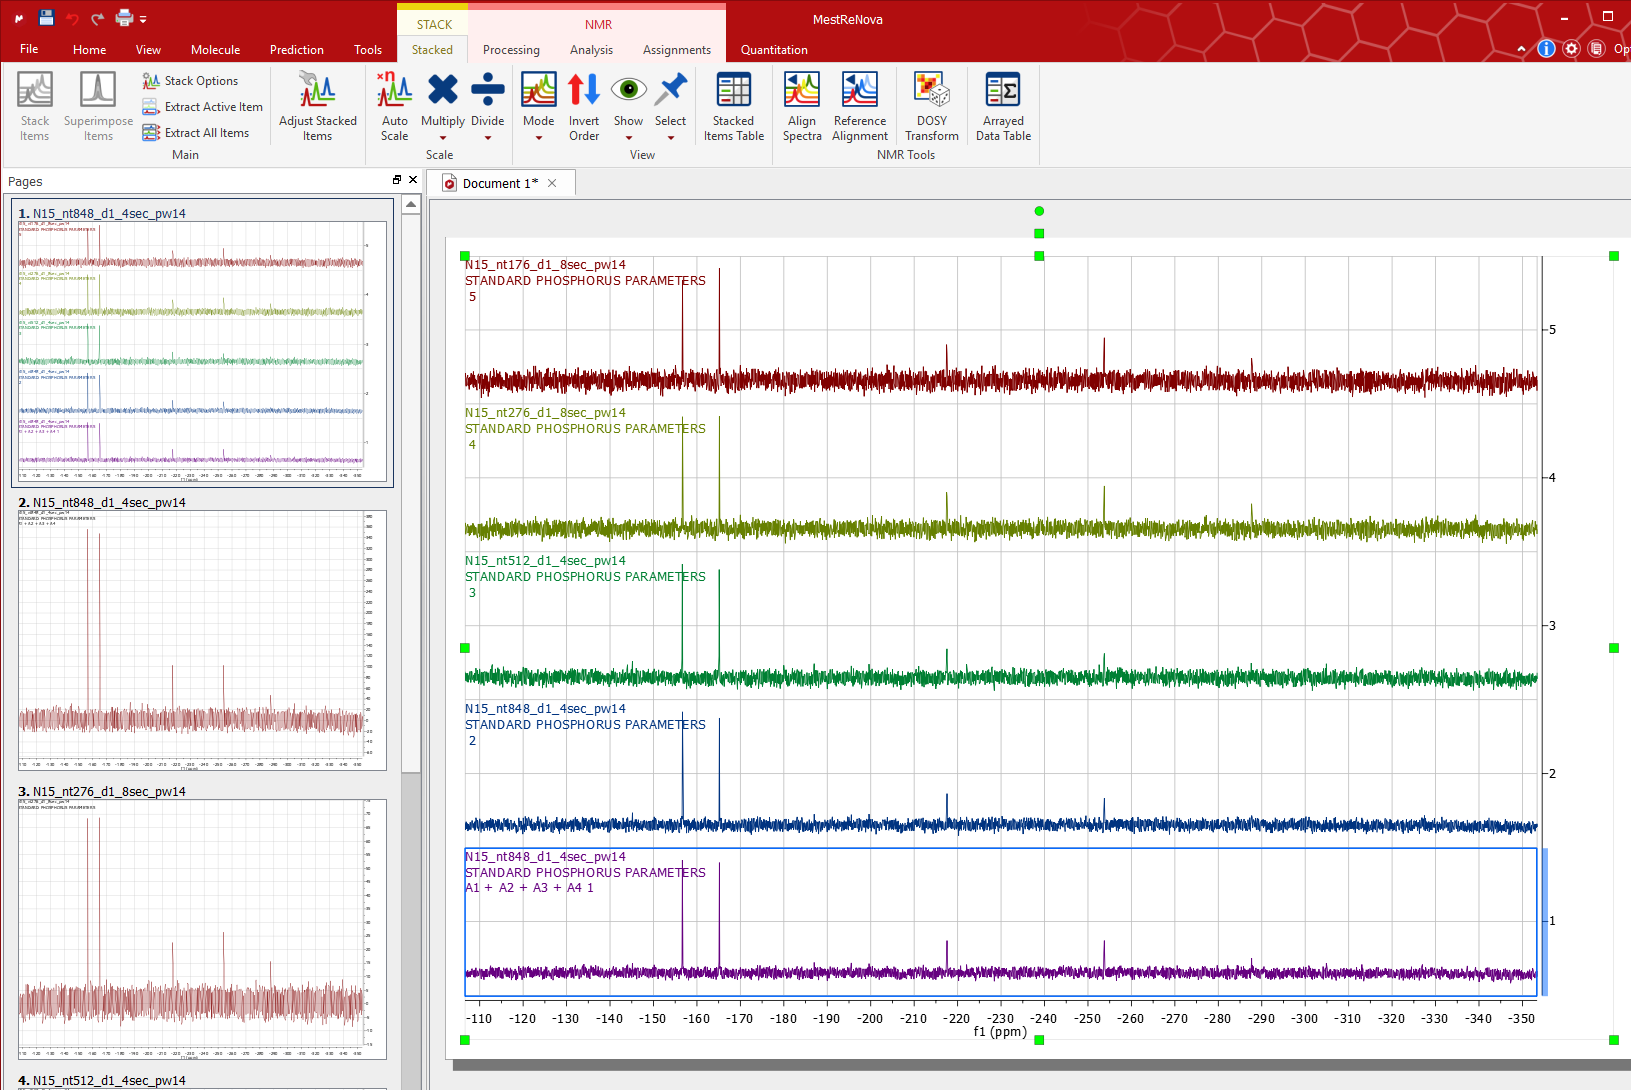
First click to show the first spectrum in the right side window. Then, simply drag the small, additional spectrum windows on the left into the expanded first spectrum window on the right, above or below the existing spectrum, to create a stacked spectrum. The order of the spectra doesn't matter for this purpose.
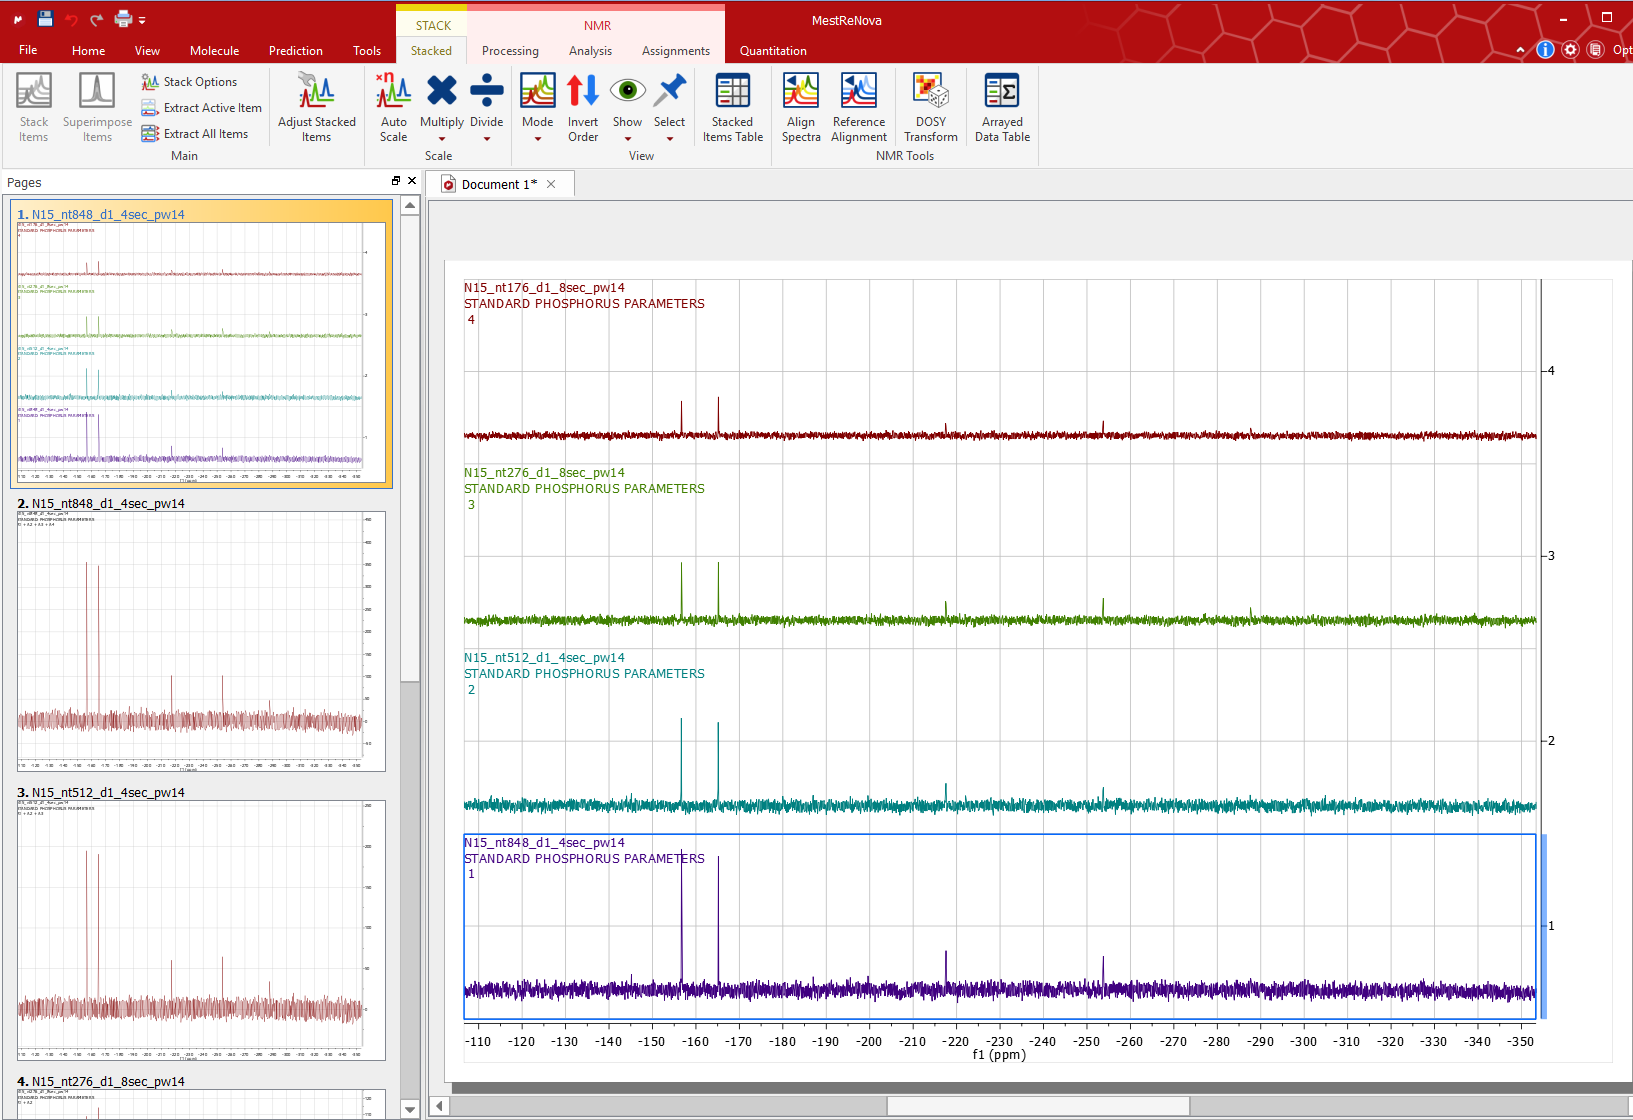 **The data are for 15N, not 31P. Disregard
the title information about the nucleus.
|
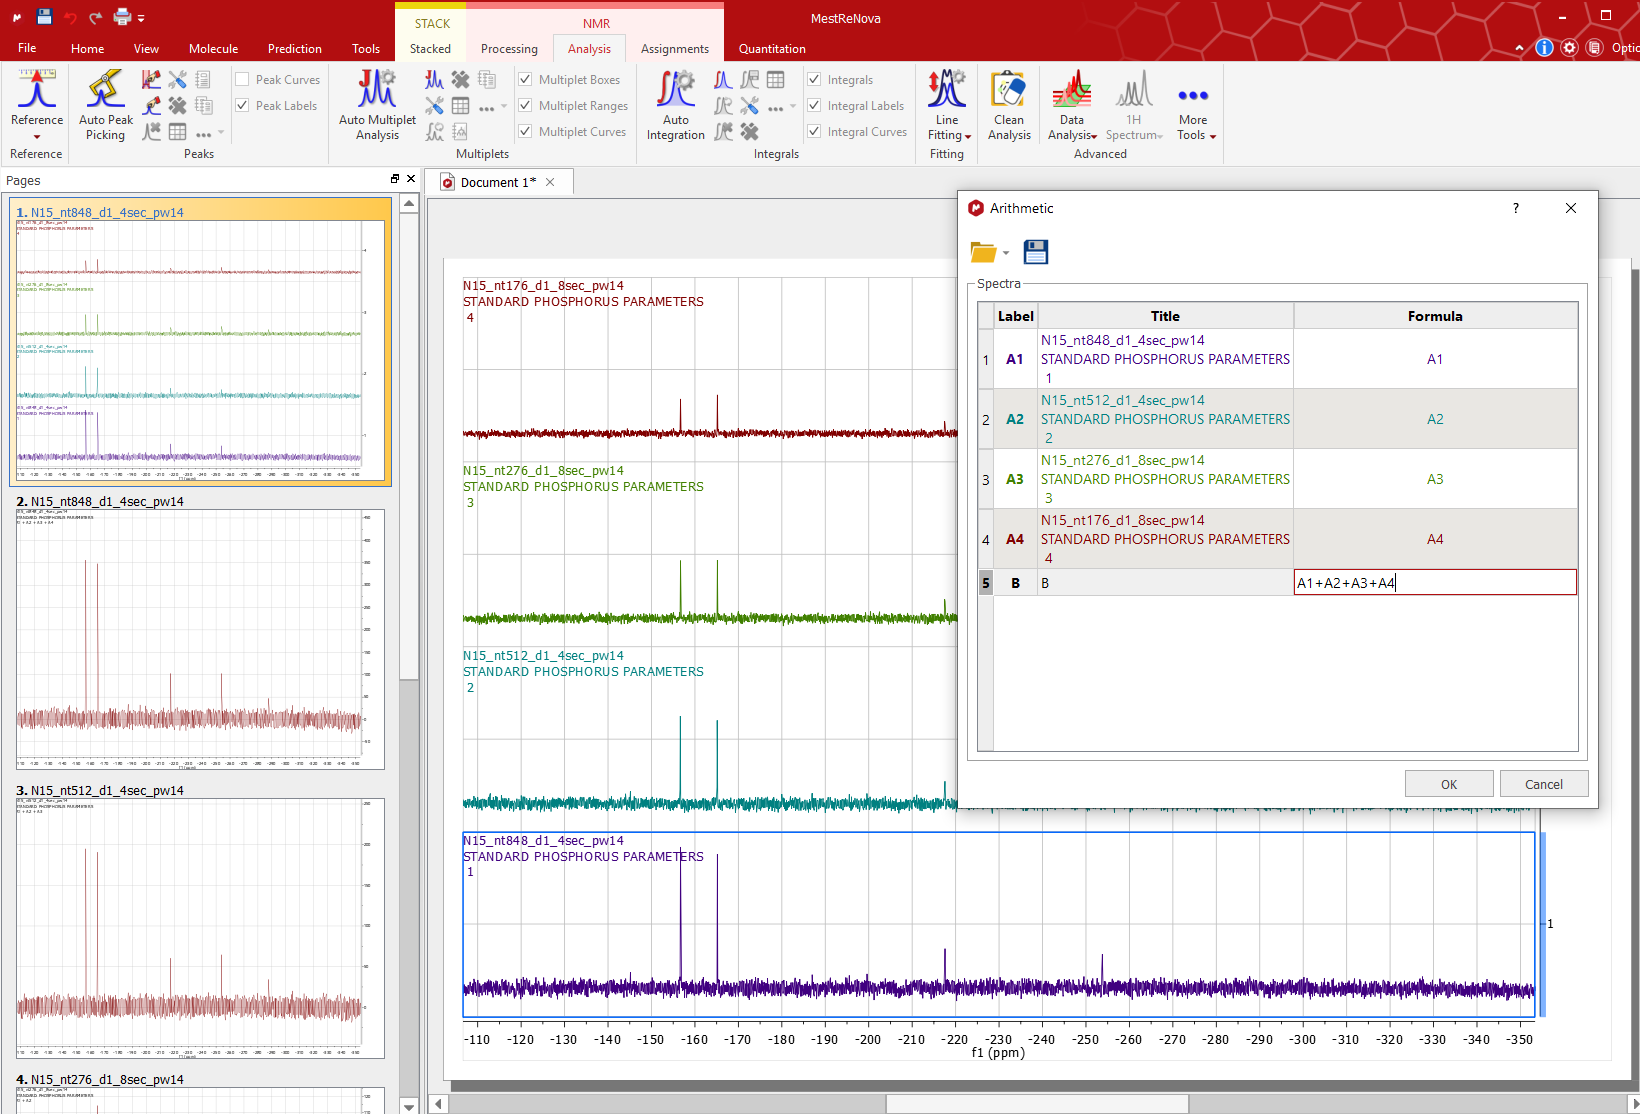
Create the arithmetic addition
Go to Analysis→More tools→Arithmetic. Here all the spectra in the stack are shown as A1, A2, A3, ... The last empty one (B) is the holder for the new sum spectrum to be created. In the Formula column of the last row for B, enter A1+A2+A3+A4. Revise this formula according to how many are in the stack or which ones you want to include. Click Ok.
 |
Check added spectrum
The new sum spectrum shows up in a new window just below the stacked spetrum window. It should give better, stronger signal-to-noise.
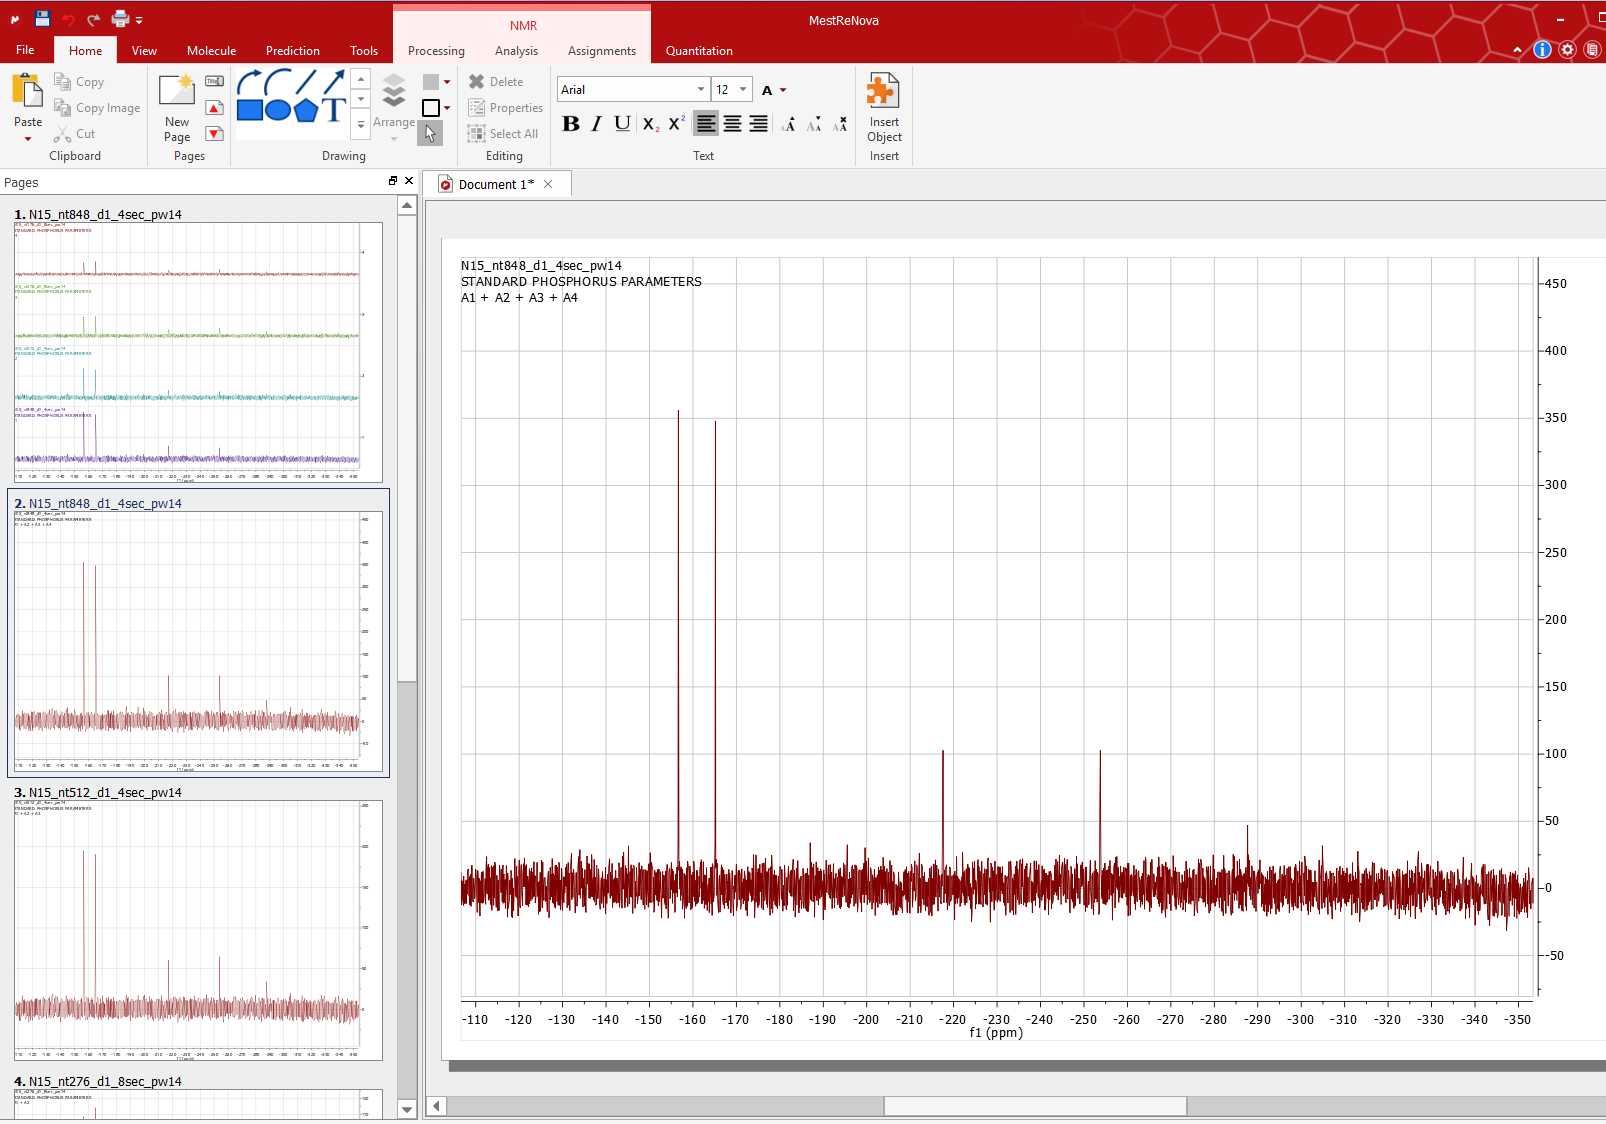 |
In the figure below, to show the change after the addition, the sum spectrum is added to the stack (last one shown) and the spectra are scaled with Stack→Stacked→Autoscale. The gain in S/N is shown as a drop in the noise level with the tallest peaks scaled roughly the same. The four separate spectra were collected with 176, 276, 512, and 848 scans, respectively. The sum spectrum is equivalent to a spectrum collected with 1812 scans.
 |
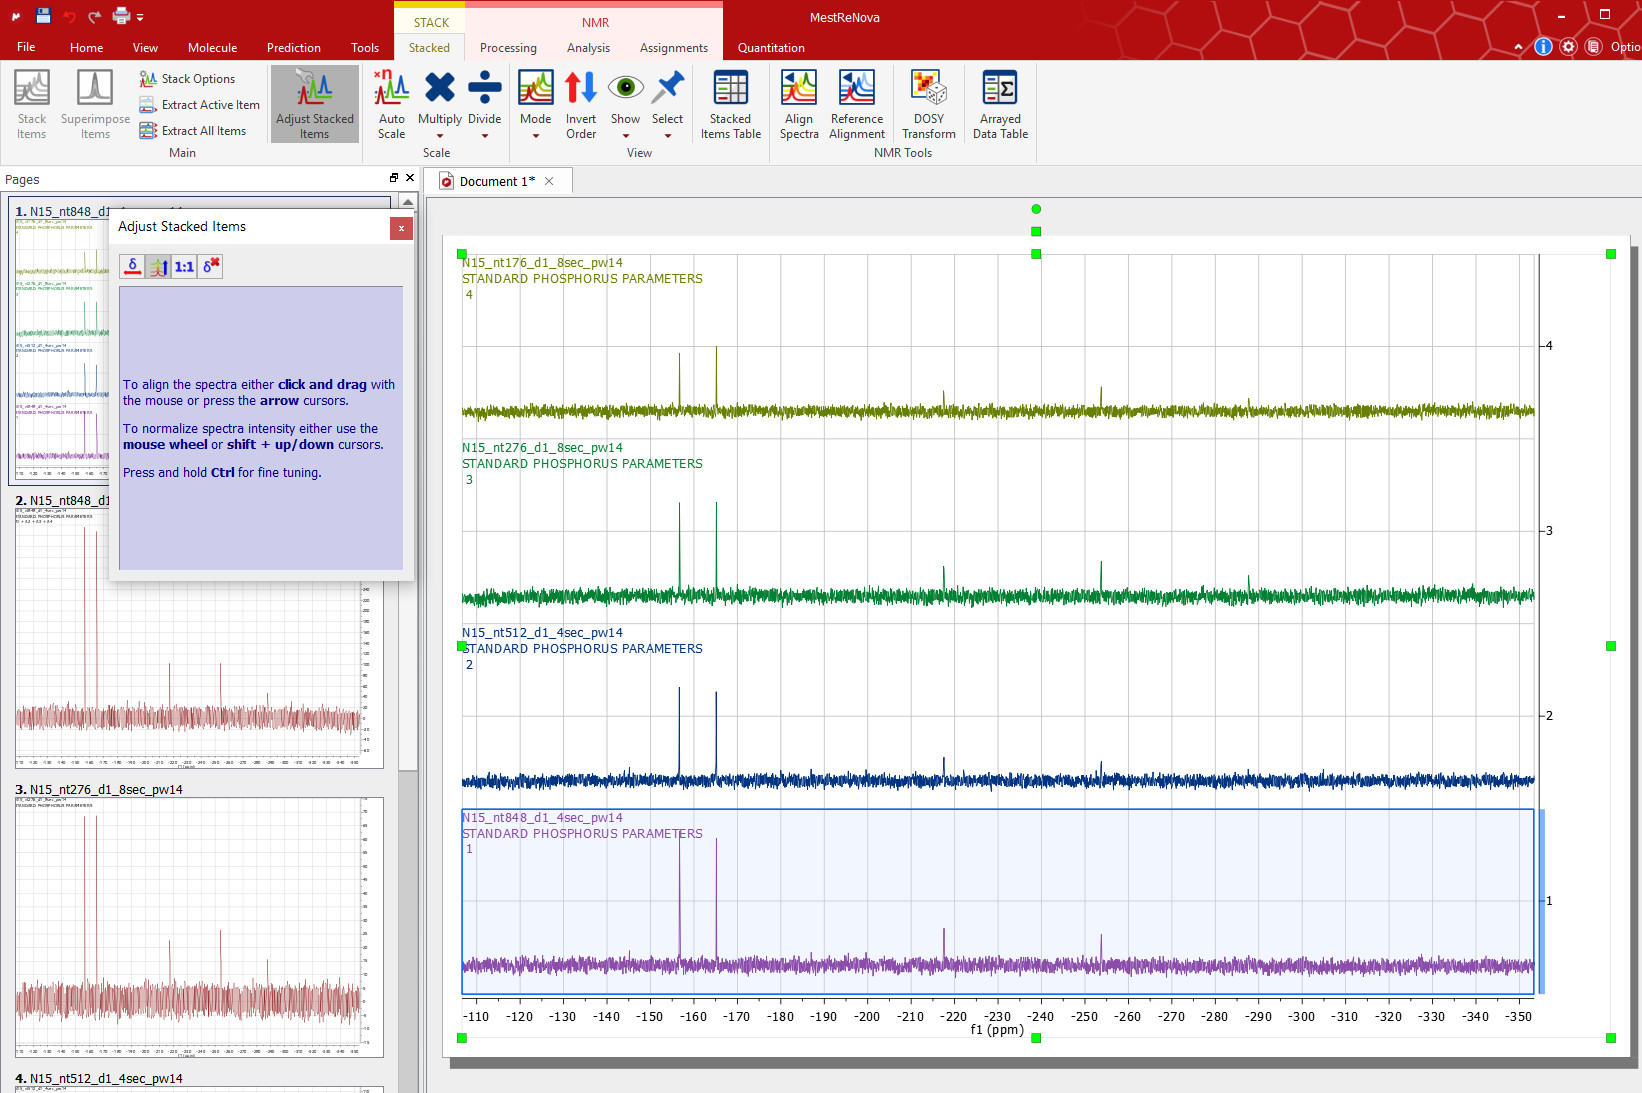
Fine tuning
See notes above regarding scaling noise level before addition. Here the noise levels of the four spectra are adjusted via Stack→Stacked→Adjust Stacked Items to roughly equal levels before adding them up.
 |
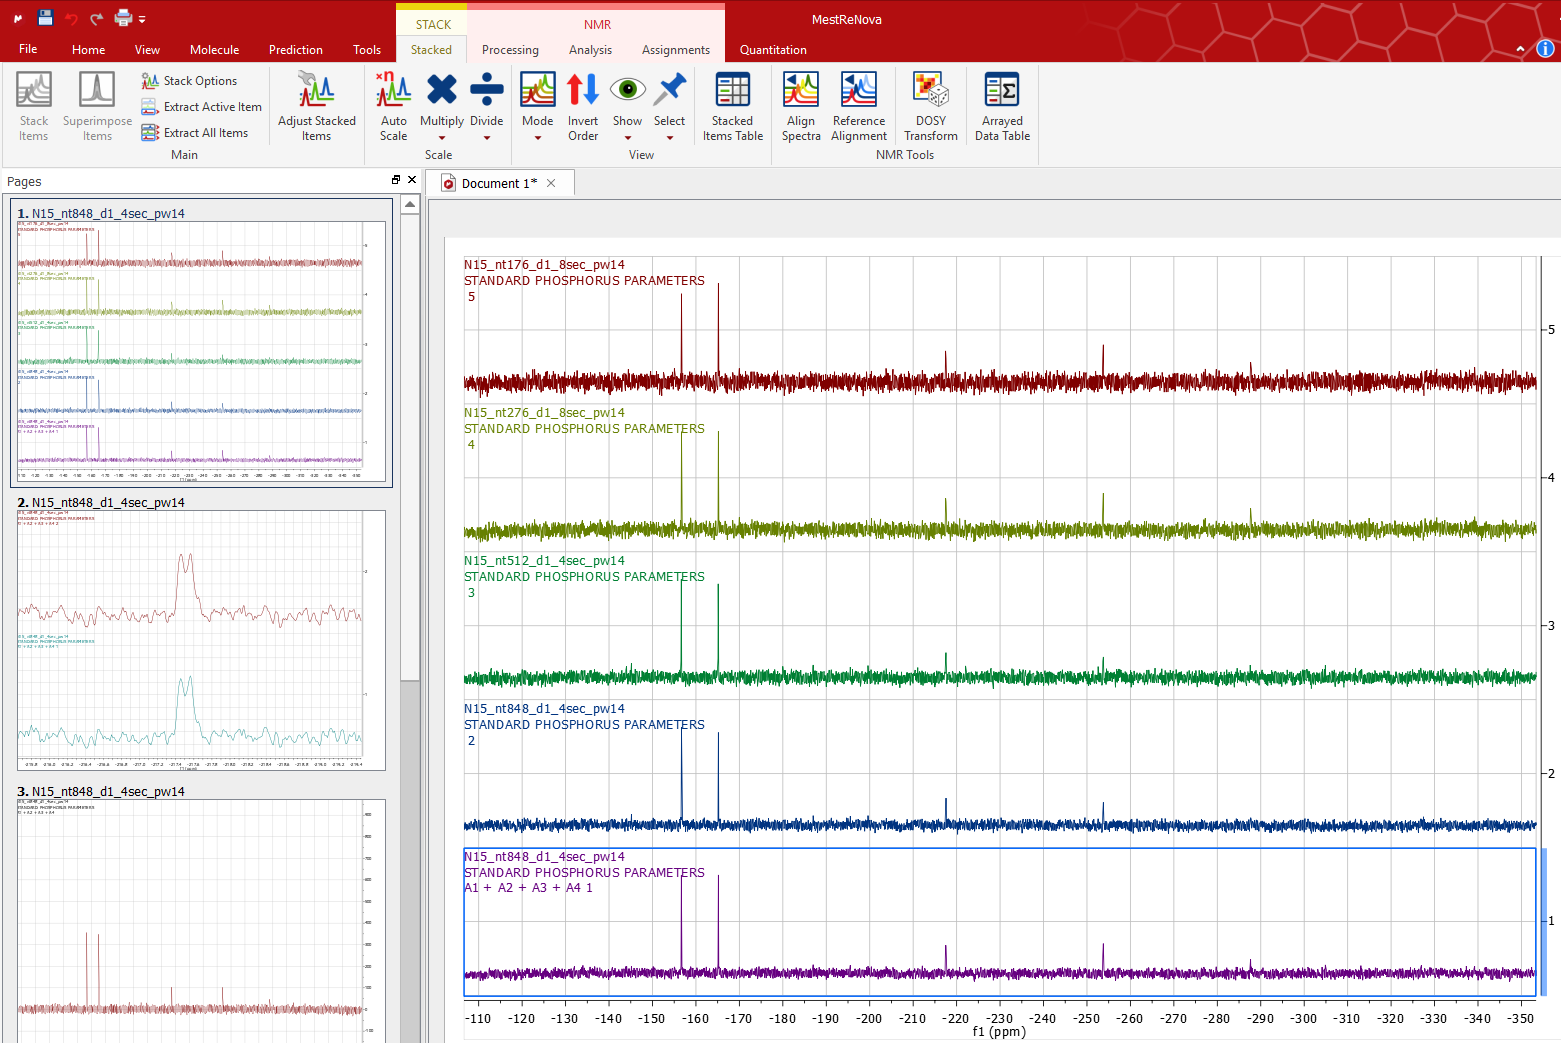
Result with proper noise scaling. The new sum spectrum is the bottom one.
 |
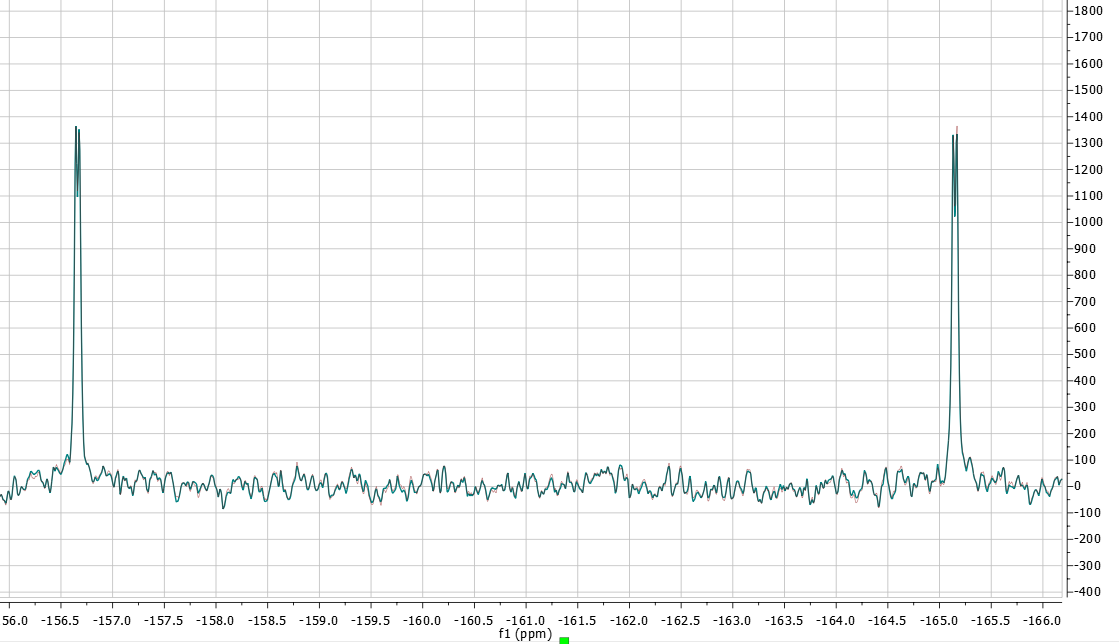
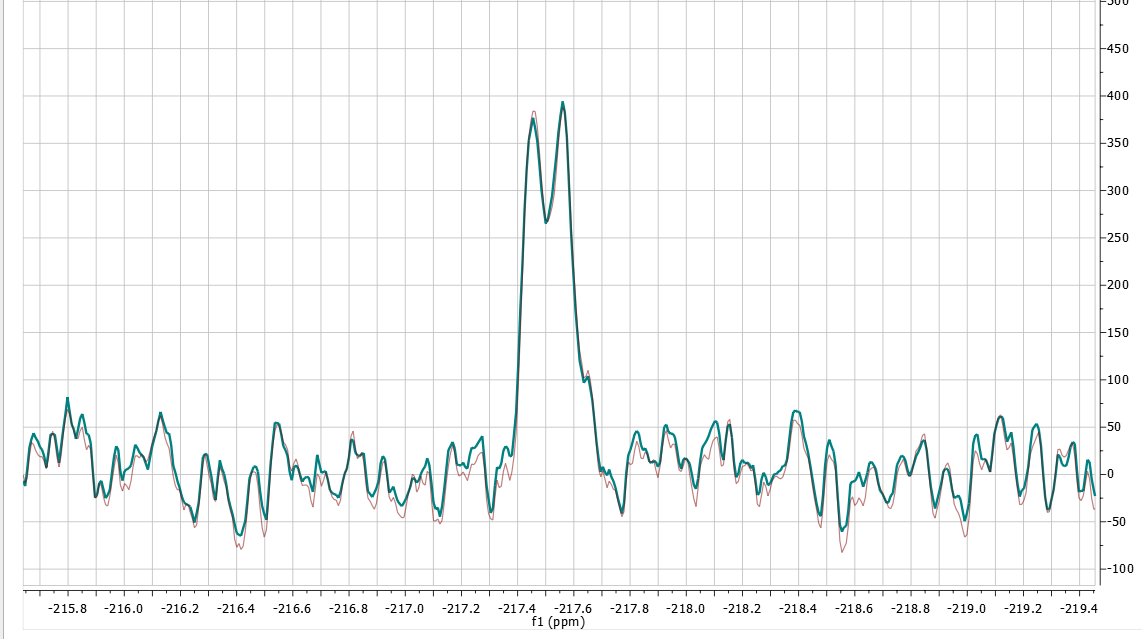
Expanded overlay of two sum spectra with and without manual noise scaling to the same level. In this case, the difference is very small. Only very small gain in S/N is visible in the new one (maroon colored).
 |
 |
Updated, Jan 2020, H. Zhou
©2020 The Regents of the University of California. All Rights Reserved. UC Santa Barbara, Santa Barbara, CA 93106