- Data collected October 2010
- Processed and displayed with nmrPipe/nmrDraw
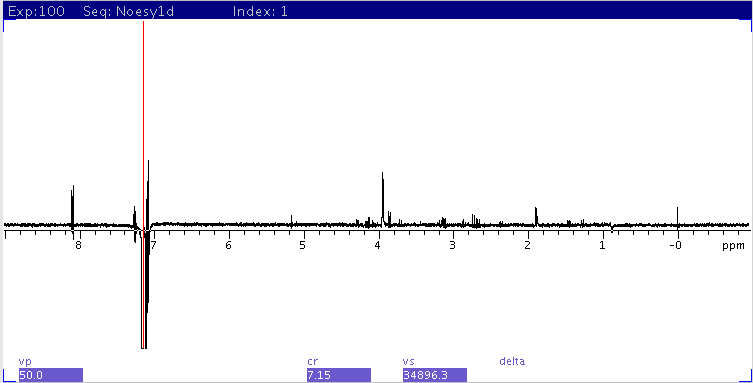
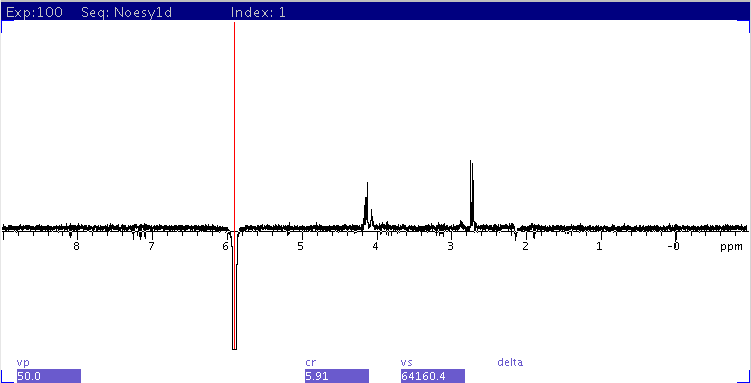
1D NOESY
- ~5 mins each experiment, with 64 scans
- red cursor line marks excitation position
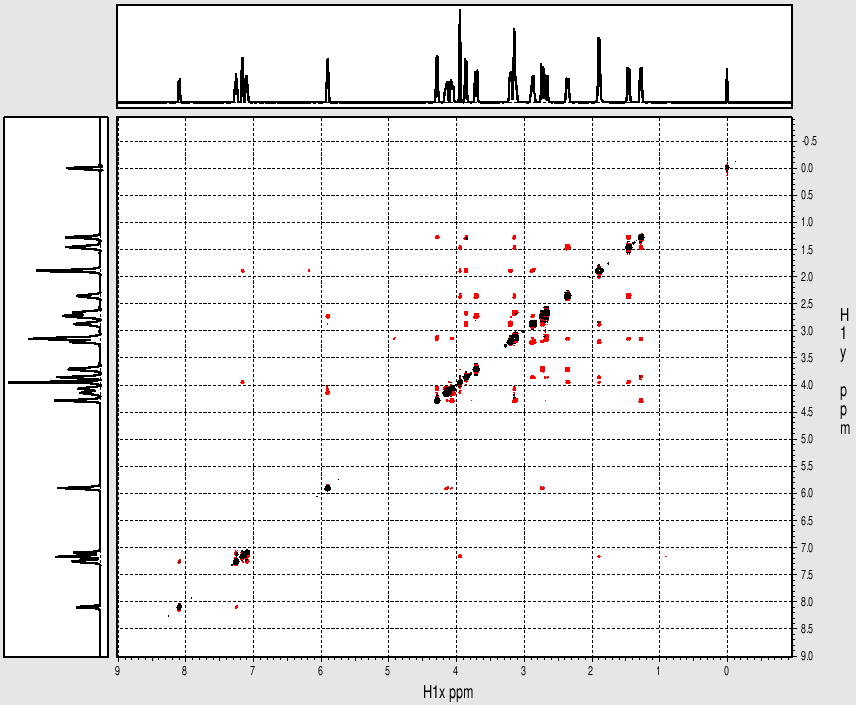
2D NOESY
- ~15-30 mins with 4 scans per increment
1D sequence: Gradient enhanced NOESY1D
2D sequence: Gradient enhanced 2D NOESY
Sample: Strychnine at ~ 25mg/mL (~ 100mM) in cdcl3
1D NOESY
2D NOESY
|
Strychnine
|
Selective inversion of the peak at ~7.2ppm (~ 5 mins). Note the imperfect selectivity of the excitation pulse excited an adjacent peak to the left which has NOE to the resonance at 8.2ppm. Also, note small residual artifact peaks across spectrum. The genuine NOE peaks appear at ~ 1.9ppm and 3.95ppm.
Selective inversion of peak at ~5.95ppm (~ 5 mins). NOE peaks appear at ~4.2ppm and 2.7ppm.
The 2D spectrum offers much better clarity and sensitivity than 1D NOESY.
15 mins experiment with ni=75. Linear prediction is applied along indirect dimension.
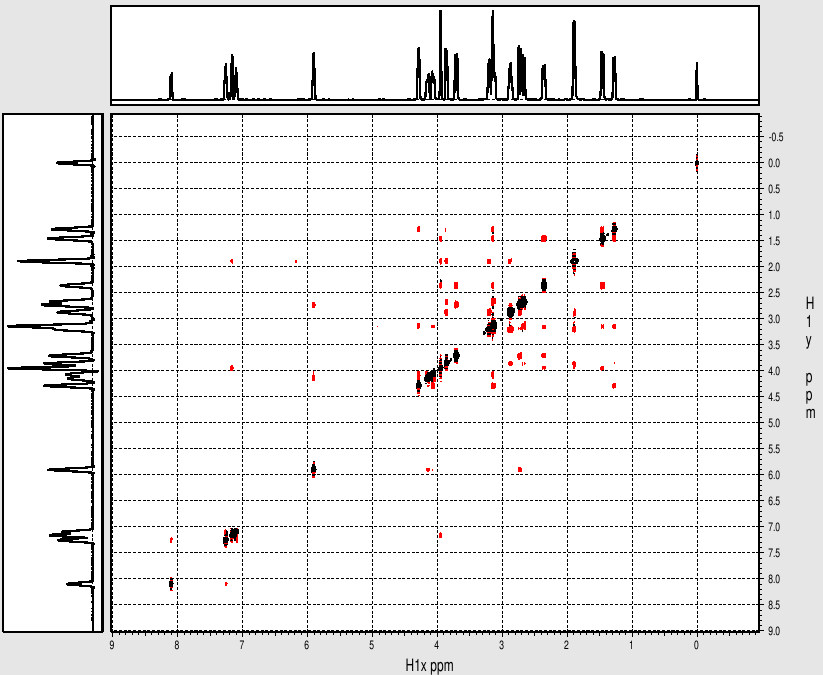
30 mins experiment with ni=150. Linear prediction is applied along indirect dimension.
H. Zhou updated Sept 2010