F19
Detection
F19 is a sensitive nucleus to detect. On most probes it is detected through
the same RF and preamp as for H1. Unlike H1, F19 has an extremely wide chemical
shift range, spanning +/- 500ppm depending on the molecule and structure. In a
majority of flourinated organic compounds, the chemical shift ranges from 100
to -250ppm. F19 also has strong homonuclear (among adjacent F19 nuclei) and
heteronuclear (to H1, C13, etc.) J-couplings. Note the following when setting
up a F19 experiment:
- Get a good estimate of chemical shift range (relative to CFCl3 at 0.0ppm)
for your compound and center your spectrum accordingly (see a F19 chemical shift table here).
- For an unknown chemical shift range, first try a large spectral width (~
500000 Hz or largest allowed) with the transmitter offset
(tof, center of spectrum) set to the center of the guess
range, or to 0.0ppm if unknown. The large spectral width prevents any
aliasing (or wrapping around of peaks) from outside the window.
- Note pulse bandwidth limitation and pulse offset effects on
phasing, excitation and integration accuracy: The F19 pulse (~ 10
usec) is not able to excite all peaks across a very large window (see
example below). To locate all F19 peaks, try to scan through the entire
range by collecting a spectrum array with the center offset changing from ~
+500ppm to -500ppm with a ~25000 Hz stepsize (see procedure below). After
the shift range is known, use movesw to narrow down the
window to signal region. For extremely large chemical shift span, you may
want to set window to one narrow area at a tme and collect several spectra.
Baseline rolling and phase distortion are common with large spectral
window.
- In a coupled spectrum (no H1 decoupling applied) and for a spectral
window of ~ 10000Hz or less, F19 integration can be as good as for H1 if proper recycle time and pulse width are set
according to T1max. Much larger window will limits integration accuracy
(see integration results in example below)
Referencing
Choose one of the following (among others) to reference your F19
spectrum:
- For most accurate and convenient chemical shift referencing, use TMS at
< 1% as an internal 0.0ppm reference for H1. F19 is indirectly
referenced relative to the TMS H1 peak accordingly to IUPAC standard.
- Alternatively, for rough referencing, type setref to use
the lock signal to reference any nucleus in the direct dimension. Note the
setref command needs solvent to be set correctly and
locked. See this page for more details.
- If locking is not possible, use neat CFCl3 as an external reference at
0.0ppm and run experiment unlocked.
Procedure for H1 coupled F19 experiment on nmr500
Step 1: Optional: Collect and reference H1 spectrum
- Lock and shim as usual.
- Under exp1 (type jexp1 to go to exp1) or another
experiment, collect a 1H spectrum. Reference TMS signal to 0.0pm. For rough
referencing with the lock signal, simply type setref.
- Join a different experiment (i.e. type jexp2 to join
exp2. To create it, type cexp(2) jexp(2).
- Type mf(1,2) wft to move data over from exp1 to exp2.
Double check referencing.
Step 2: Optional: Estimate F19 transmitter offset to use (Skip this
step if you do not know what ppm range your F19 signals cover)
- Type dn='F19' to set channel 2 to F19.
- Type setrefppm
- Enter 1 for 1st decoupler nucleus
- Enter the ppm value you want to use as center of
F19 spectrum: (i.e. -100)
- Write down the offset value printed on screen.
Step 3: Change F19 filter and tune probe
- Type setexp('F19') to load standard F19 detection
parameters. Type su.
- Replace the H1 bandpass filter on the right side of the H1/F19 preamp
with a F19 bandpass filter (labeled).
- Tune channel 1 to F19 following the
same procedure as you would for H1. Make sure cables are reconnected
back to normal configuration after tuning.
Step 4: Set up F19 experiment
- If you have done Step 2, type tof=###
where ### is the value from Step 2. Otherwise, use default value (set to ~
-92ppm).
- For first time NMR work on a compound, try a few test runs to see where
the signals are and set an appropriate spectral width (sw)
and center (tof).
- Type sw=500000 (or maximum
allowed by software). For konwn chemical range, set sw and
tof accordlingly.
- Set gain=36 for quick run
(gain='n' for autogain is fine but slower). Set
nt=4 (or larger if signal is weak). Type
go to collect data, and wft f full when
done. If receiver or ADC overflows, drop gain by 2 at a a
time.
- Type aph to phase spectrum. You
may see some baseline rolling due to the large spectral width and phasing.
- Put box cursor to enclose the peak regions but
leave ~10% baseline area on both sides. Type movesw to set
new spectral window to this area.
- Type go to re-collect data and
wft f full to process it.
- To reference spectrum:
- Type mref(1,2) to use
referencing in exp1 (1H spectrum) to reference F19 spectrum in exp2
(current)
- OR: type
setref to use lock signal for rough referencing
Default parameters
- d1=4.8 at=2.5 tpwr=57 pw=10 sw=100000
nt=4
- tof centered at ~ -92.5 ppm
Step 5: Collect final spectrum
- Once an appropriate spectral window is set, set nt to
multiple of 4 and collect data.
- For uniform excitation, and best baseline and integration accuracy
involving multiple F19 peaks, it is better to collect several spectra with
a smaller (~10000-20000 Hz) sw centered around different
signal regions.
Step 6: Processing
- Type wft f full aph. Adjust lb
(lb=0.2 or lb=0.5 ..), followed by
wft, to smooth spectrum without adding too much
line-broadening.
- Double check referencing with mf(1,2) or
setref
- You may see baseline rolling due to the large spectrum width of F19 after
phasing. To minimize its impact, try the following:
- Make sure you have not accidentally applied a
very large first order phase correction (lp parameter).
Type lp?. If the value is over a few hundreds, it means it
may have caused the baseline rolling, sometime caused by incorrect manual
phasing. Type lp=0 to turn the 1st-order phasing to zero.
Then, type aph0 to only apply zero-order phasing. If that
does not phase all peaks across spectrum,, try aph to
include 1st order phasing.
- To fix small baseline rolling (as shown in example below), try baseline correction with
bc command.
- Optional: To reduce the requirement of 1st order phase
correction, adjust certain dealys in the pusle sequence and re-collect data
(note this may not work well for very large bandwidth):
- First, use aph or manually
phase all peaks up across spectra.
- Type calfa. Recollect and
process data. lp required should be reduced now.
Step 7: Recable and tune probe back for H1
- Replace F19 filter with H1 filter
- Type tn='H1' su and tune channel 1 back for H1
detection
How to scan through the entire F19 shift range in an arrayed experiment
- Find out tof value of 0ppm for F19 according to
procedure in Step 2, or set tof to a guessed center value
- Type sw=500000 (or maximum allowed by software)
- Under a F19 detection experiment, type array
- Enter parameter to array:
tof
- Enter number of steps: 25
- Enter starting value: -250000 (subtract
0.5*tof)
- Enter stepsize: 20000
- Type nt=1 gain=36 go to collect data.
- Click Process->Text Ouput to view array index and
values
- Type wft dssh dssl to display all spectra while data
being collected. Type ds(#) f full to display spectrum
number #. Type vs=vs*0.5 to shrink peak height by half,
dssh dssl to redisplay spectra.
- Once the signal region is located, display the best spectrum enclosing
all peaks. Use box cursor to enclose region with ~10% baseline region on
each side. Type movesw to set spectral window to box
cursor region.
- Re-collect data with nt=4 (or multiple of 4). Readjust
window size if needed.
Example
- Sample: Lufenuron ~20mg/mL in CDCL3
- Data collected in Dec 2010
- Chemical shifts assigned, from left to right in structure, based
on a F19 chemical shift table and
integral ratios are:
- CF3: -75ppm
- CF: -210.5ppm
- CF2: -78 and -79 ppm
- CF/CF in ring: -110ppm
|
Lufenuron
|
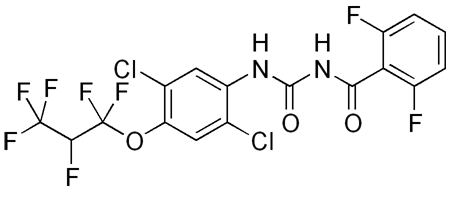
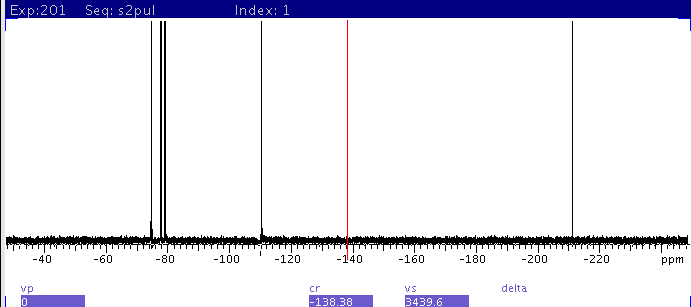
| 1: spectrum with sw=500000 centered
at -201 ppm. Note the baseline rolling and phase abnormality due to the
large bandwidth and pulse offset effect. |
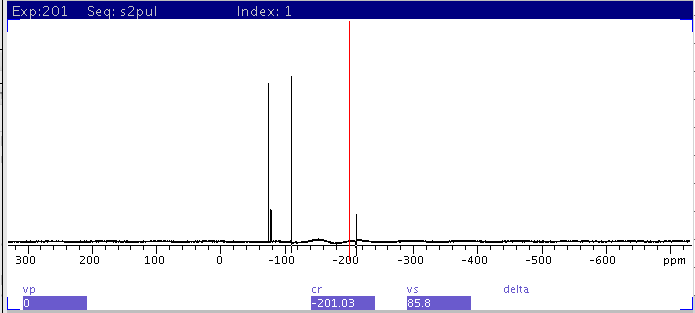 |
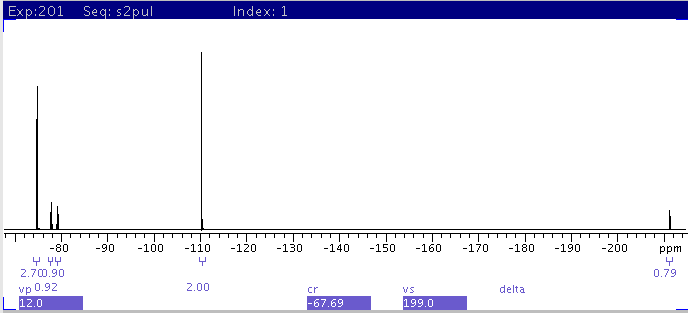
| 2: spectrum with sw=500000 centered
at 0 ppm. Compare with 1 and note the F19 peak at
-211ppm did not get excited and is missing from the spectrum due to the
large offset from transmitter center. Also note the changes in relative
intensity of the peaks from 1. |
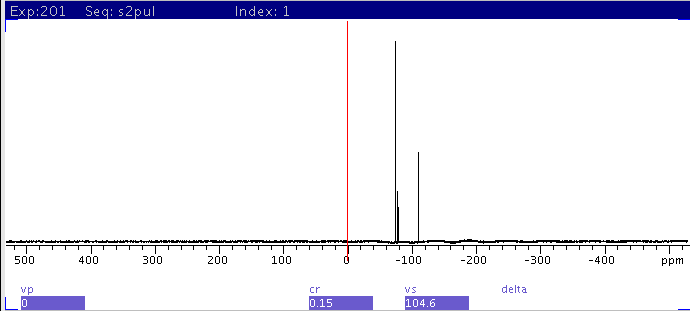 |
| 3: Narrow down spectral window with
movesw to enclose all peaks found in
1 and recollect data (nt=4). Note baseline rolling due
to large 1st order phase correction. |
 |
| 4: Apply baseline
correction with bc command |
 |
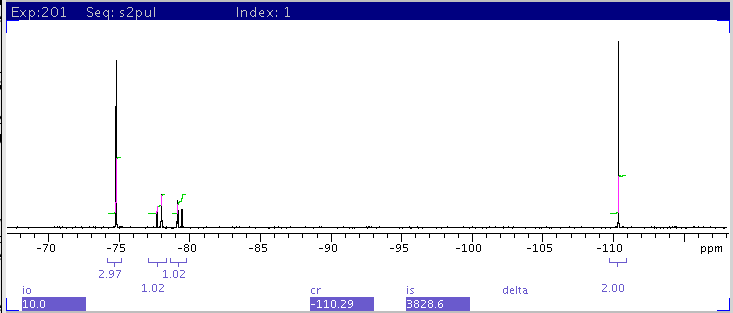
| 5:Following 4, reset integrals and
scale integral of peak at -110ppm to 2. The integral for each multiplet
from left to right, is: 2.7, 0.92, 0.90, 2.0, and
0.79. |
 |
| 6: Window size is further cut down to only include
the four peaks on the left with transmitter centered at -92.5ppm. The
integrals for the multiplets from left to right, are: 2.97, 1.02, 1.02,
2.0. These values are much more accurate than in
5. |
 |
H. Zhou
updated Dec 2010