H. Zhou updated Oct 2010
See parameter setup and notes on quantitative 13C NMR below.
In a typical 1D multi-scan experiment, the spins are repeatedly rotated from Z-axis with a single pulse into the XY plane for detection. A typical rotation is done by a 90 degree pulse with width pw, measured in usec. However, the recycle time (D=d1+at, including acquisition time at and recycle delay d1 on Varian systems) between the scans is often shorter than T1 (longitudinal relaxation time), the time constant for the spins to relax back to equilibrium along Z. It is known that in this repetitive single pulse experiment, once steady-state is established after some pulses, the optimal signal amplitude occurs with a smaller than 90 degree pulse. The optimal flip angle depends on T1 and the recycle time. The shorter flip angle corresponds proportionally to a shorter pw. The following theoretical curves illustrate this.
Figure 1: Signal Amplitude Dependence on Rotation Angle and D/T1
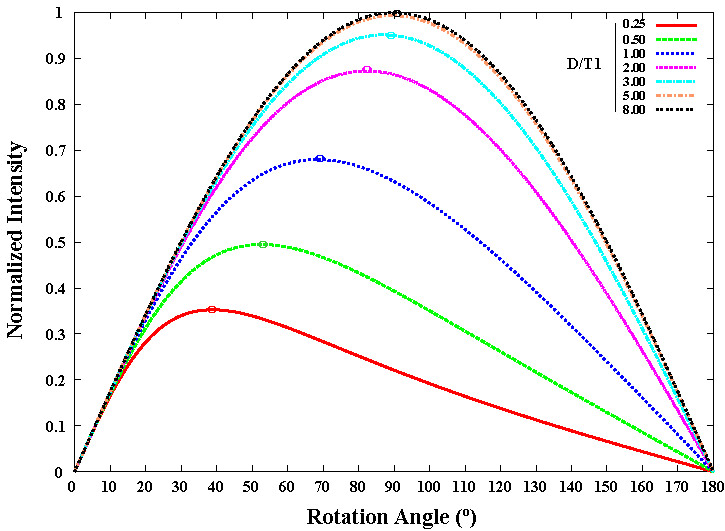
If the recycle time is much shorter than T1 (smaller D/T1), the optimal rotation angle drops below 90 degree. With D/T1 ~ 1/4, the optimal angle shifts to ~ 40 and maximum normalized signal amplitude obtained drops to ~ 35%. If D > 3T1, more than 95% of the signal is recovered with a near 90 degree flip angle.
The picture above is only half the story. Although signal amplitude drops as the recycle time gets shorter, a fair comparison and what really matters is (1) accumulated signal sensitivity and (2) integration accuracy within a fixed time frame. The choice is (1) cut down D and accumulate more scans with a lower signal recovery for each scan , or (2) use a longer D (>=3*T1) and fewer scans with each scan recovering nearly 100% of the signal. As an example, if T1 ~ 3 sec, we ask what combination of d1 and rotation/flip angle gives the most sensitivity (signal/noise ratio) within a fixed amount of time?
Figure 2: Sensitivity Dependence on Rotation Angle and Recycle Time
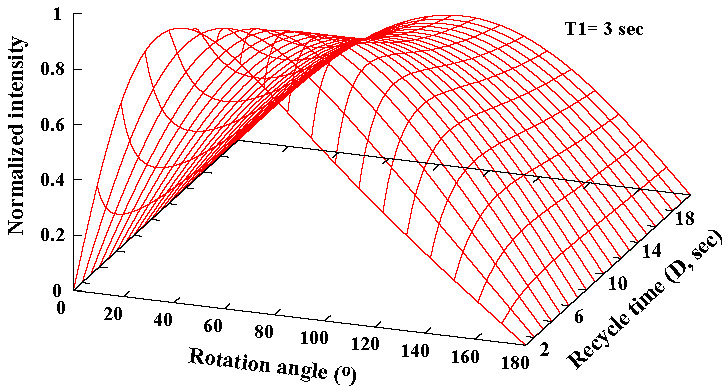
Figure 2 shows the normalized sensitivity as a function of flip angle and recycle time. The flip angle dependence of optimal signal does not change. The flatness or shallow slope along the D axis in the figure above, however, indicates that D itself does not make as much a difference in sensitivity as rotation angle does; the majority of the loss from using a short D is gained back through more scans, as long as the flip angle is chosen to be around the optimal value.
Since T1 values for various 1H's differ in a molecule, a single flip angle and recycle time (as done in a typical experiment) are not optimal for all 1H's. Consequently, the resulting integration of various 1H signals does not scale according to the number of atoms if their T1's are different. To get accurate integration, a compromised recycle time must be used for a given range of T1 values to minimize the integration scaling error while retaining as much sensitivity as possible. The following table is based on a theoretical calculation targeting 90% integration accuracy, given a fixed data acquisition time (at) of 2.5 sec as in a typical 1H experiment.
For a typical non-degassed organic sample, T1 has a range of from ~0.5 to ~3.5 sec for various protons. From this table, the best sensitivity drops to ~72% in order to achieve an integration accuracy above 90% over this T1 range. To achieve this goal, the recycle delay d1 needs to be ~4.8 sec and the flip angle needs to be ~75 degree. A few general observations:
Table1: Optimal d1 and flip angle targeting 90% integration accuracy for a combination of T1min and T1max in the sample
The 1st column and row are T1min and T1max, respectively (in second). For each combination of (T1min,T1max), four numbers are displayed: 1st row - relative sensitivity (%); 2nd row (bold black) - integration accuracy (%); 3rd row (red) - recycle delay (d1, second); 4th row (green) - flip angle (degree). The sensitivity is calculated relative to the maximum possible with at=2.5, and an average T1 between T1min and T1max at its optimal flip angle.
| 0.0 | 0.5 | 1.0 | 1.5 | 2.0 | 2.5 | 3.0 | 3.5 | 4.0 | 4.5 | 5.0 | 5.5 | 6.0 | |
| 0.0 | 100.0 100.0 0.0 90.0 |
99.7 99.3 0.0 90.0 |
96.6 91.7 0.0 88.0 |
85.2 90.0 0.6 74.0 |
77.3 90.1 1.6 73.0 |
72.8 90.2 2.8 76.0 |
70.3 90.1 3.6 72.0 |
68.8 90.0 4.8 75.0 |
67.6 90.0 6.0 77.0 |
66.8 90.0 6.8 74.0 |
66.1 90.2 8.0 75.0 |
65.8 90.1 9.0 75.0 |
65.4 90.1 9.8 73.0 |
| 0.5 | 100.0 100.0 0.0 90.0 |
99.1 92.4 0.0 88.0 |
89.2 90.2 0.6 74.0 |
81.5 90.1 1.6 73.0 |
76.9 90.2 2.8 76.0 |
74.1 90.1 3.6 72.0 |
72.3 90.0 4.8 75.0 |
70.9 90.0 6.0 77.0 |
69.8 90.0 6.8 74.0 |
68.9 90.2 8.0 75.0 |
68.4 90.1 9.0 75.0 |
67.8 90.1 9.8 73.0 |
|
| 1.0 | 100.0 100.0 0.0 85.0 |
99.5 90.1 0.0 77.0 |
87.6 90.1 1.2 70.0 |
81.7 90.0 2.4 71.0 |
78.2 90.0 3.6 73.0 |
75.8 90.1 4.8 75.0 |
74.0 90.0 6.0 77.0 |
72.8 90.0 6.8 74.0 |
71.6 90.2 8.0 75.0 |
70.9 90.1 9.0 75.0 |
70.2 90.1 9.8 73.0 |
||
| 1.5 | 100.0 100.0 0.0 79.0 |
100.1 90.1 0.0 74.0 |
89.3 90.0 1.4 66.0 |
83.2 90.1 3.2 72.0 |
79.8 90.0 4.6 75.0 |
77.4 90.0 5.4 71.0 |
75.6 90.2 6.8 74.0 |
74.4 90.0 7.8 74.0 |
73.3 90.1 9.0 75.0 |
72.6 90.0 10.0 75.0 |
|||
| 2.0 | 100.0 100.0 0.0 73.0 |
100.2 90.9 0.0 71.0 |
91.7 90.1 1.4 63.0 |
85.3 90.0 3.8 73.0 |
81.5 90.1 5.0 71.0 |
79.1 90.1 6.4 73.0 |
77.2 90.0 7.2 70.0 |
75.9 90.1 8.4 71.0 |
74.8 90.1 10.2 77.0 |
||||
| 2.5 | 100.0 100.0 0.0 68.0 |
100.1 92.1 0.0 66.0 |
94.6 90.1 0.0 48.0 |
87.6 90.0 3.6 67.0 |
83.6 90.0 5.4 70.0 |
80.8 90.0 6.6 69.0 |
78.8 90.1 8.2 72.0 |
77.4 90.0 9.6 74.0 |
|||||
| 3.0 | 100.0 100.0 0.0 64.0 |
100.1 92.9 0.0 63.0 |
97.2 90.1 0.0 49.0 |
89.8 90.0 3.2 62.0 |
85.4 90.1 5.6 68.0 |
82.5 90.0 7.4 71.0 |
80.4 90.0 9.0 73.0 |
||||||
| 3.5 | 100.0 100.0 0.0 61.0 |
100.1 93.8 0.0 59.0 |
98.9 90.2 0.0 50.0 |
92.0 90.0 2.0 53.0 |
87.3 90.0 4.8 61.0 |
84.2 90.0 7.4 68.0 |
|||||||
| 4.0 | 100.0 100.0 0.0 58.0 |
100.1 94.5 0.0 56.0 |
100.0 90.1 0.0 52.0 |
94.2 90.1 1.2 48.0 |
89.2 90.0 4.4 58.0 |
||||||||
| 4.5 | 100.0 100.0 0.0 55.0 |
100.1 95.0 0.0 54.0 |
100.2 90.3 0.0 53.0 |
96.3 90.0 0.0 40.0 |
|||||||||
| 5.0 | 100.0 100.0 0.0 53.0 |
100.0 95.4 0.0 52.0 |
100.2 91.1 0.0 51.0 |
||||||||||
| 5.5 | 100.0 100.0 0.0 51.0 |
100.0 95.8 0.0 50.0 |
|||||||||||
| 6.0 | 100.0 100.0 0.0 49.0 |
First, in all cases, setting d1>3*T1max pw=pw90 always give >95% integration accuracy while losing significant sensitivity due to the long recycle time. This, however, is the ultimate method to retain reliable integration. The following should apply to most routine work targeting 90% integration accuracy.
*For a non-degassed sample:
These values have been set as default in the initialization script (init1h).
*For a degassed sample (where O2 is removed):
T1 values of 13C nuclei are significantly longer than 1H ( at least twice as long). With the common pulse sequence parameter settings, 13C integration quantitation is difficult because the long T1, off-resonance excitation effect due to the large bandwidth, and 1H->13C NOE that contributes differently to the 13C signals. The following is recommended based only on optimal sensitivity calculation:
When integration accuracy is desired for any nucleus (excluding other factors affecting integration)
In all cases, set d1>3*T1max always give >95% integration accuracy.