2D 1H-13C
HSQC
2D Gradient Enhanced 1H-13C HSQC
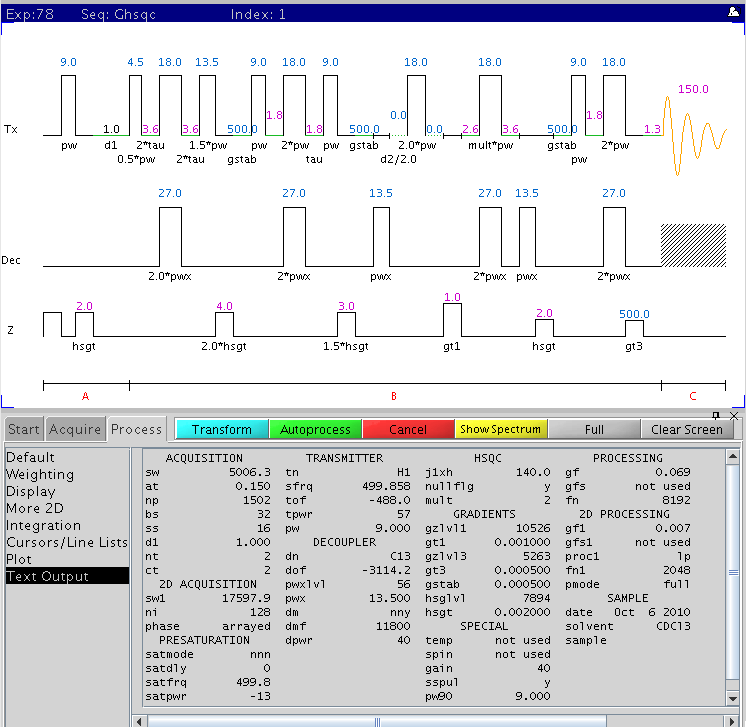
The following figure is the Varian gradient selected 2D 1H-13C HSQC pulse
sequence (gHSQC) with the main parameters displayed (NMR500).
Procedure (on NMR500)
- Temperature must be regulated.
- Turn spin OFF.
- Gradients amplifier should be turned on (displays RUN).
Type pfgon='nny' su to allow gradient pulses.
- Lock and shim your sample as usual, except also adjust X and Y shims a
bit (because spin is off now). Keep lock at ~80% after
shimming.
- Find proper sw and tof to use for 1H
channel
- Under exp1 (type jexp1 to go
there) collect a standard 1H spectrum with nt=1 (or 4 for
cleaner spectrum)
- Put the box cursor to enclose the signal region
and to include ~10% flat baseline area at each end of the peak region. Type
movesw. This command sets a new spectral width
sw and spectrum center tof.
- Run another 1H spectrum with
nt=1or 4 with the new setting. Reference
the spectrum carefully.
- Decide what 13C dof (center of spectrum) to use for 13C
channel.
- In the following we assume we want the 13C
center to be at 70ppm with a spectral width of 140ppm to give a 13C range
of 0 to 140ppm.
- Under exp1, following last step with 1H spectrum
referenced, type dn='C13'
- Type setrefppm and enter the
center ppm value you want. For 70ppm, enter 70.
- Write down the dof value
printed out above the command line. This is the offset value for 70ppm for
13C.
- Load standard ghsqc parameter file
- Type jexp2 to goto exp2. From
exp2, type mf(1,2) to move fid from exp1 to exp2. Type
wft f full to display spectrum. Check reference.
- Type setexp('ghsqc')
su to load standard ghsqc parameters. Solvent, and 1H
spectral width and center are copied over from 1D spectrum.
- Type su. Tune 1H channel and X nucleus channel. Accuracy
of pre-calibrated pw depends on probe tuning.
- Recable the X nucleus probe input cable.
- Disconnect the X nucleus cable at the filters in
front of the broadband preamp (left side). Connect the X-channel probe
input cable to one end of the long, 13C bandpass filter (labeled 13C on
filter) on the floor. Connect the other end of the filter to the X-channel
decoupler cable coming from the back of the magnet leg interface (long,
tall box to the right of the magnet).
- Re-shim Z1 and Z2 a bit after this cabling
change.
- Check/set proper 1H transmitter power and pulse width. If solvent is
CDCL3, tpwr=57 pw=9.0. For other solvents, calibrate pw
according to this
procedure.
- Use default parameters values (~12 mins experiment) except the
following:
- pw=XXXpw90=pw
(9.0 for cdcl3 as solvent or value calibrated with your solvent at
tpwr=57)
- dof=XXX (value found above)
- sw1=XXX Estimate it based on
how much you need to enclose all 1H-attached 13C peaks around
dof. As an example, for a 160ppm width, type
sw1=160*dfrq.
- Optionally, for better quality data (may results
in longer data collection time):
- ss=32 (more dummy scans before
data collection)
- nt=4 (or 8, 16, 24, ... 4*n) for
more sensitivity and less artifacts
- ni=200 (better resolution along
indirect dimension)
- d1=2 (for less artifacts and
sensitivity, but doubles data collection time)
- Type time to check experiment time.
- Type go to collect data.
- Watch for ADC or receiver overflow:
- In arrayed experiments such as 2D's, a fixed
gain (not autogain) must be set. Watch the receiver overflow light and the
ADC overflow error message immediately after the experiment starts. If the
receiver overflows (red light blinks on VT display) or ADC overflow message
is seen above the command area anytime during the experiment except during
the dummy scan period, it is likely the data are ruined. Stop the
experiment and reduce gain by 2-4 at a time until the overflow disappears.
The default (gain=40) works most of the time unless there
is an extremely strong 1H signal in your sample. With a gain above 20, it
makes only small differences.
- After the experiment is done, recable the X (decoupler) channel
connection to the original configuration.
Default parameters
The default setting (modified from Varian's default values) in our parameter
set uses the following for a quick HSQC experiment:
- ni=128 (128 complex points along indirect dimension)
- d1=1 (recycle delay between scans is 1 sec)
- ss=16 (16 dummy scans before actual data collection)
- nt=2 (2 scans)
- C13 (dof) centered at 70ppm
- C13 sw1 ~ 140ppm
- mult=2 (1H multiplicity detection on)
- phase=1,2 (phase-sensitive, hypercomplex mode in
indirect detection)
- gain=40 (reduce it by 2 at a time if receiver or ADC
overflows)
- sspul='y' (solvent suppression and spin predelay
randomization with homospoil gradients turned on)
Data Processing
You can use vnmrJ to process the data, but vnmrJ's graphics display for 2D
spectrum leaves much to be desired. A separate program is strongly recommended
for detailed processing and analysis.
One of the most widely used free processing/display software package for
multi-dimensional NMR data processing is nmrPipe/nmrDraw. This
program package has been installed on NMR500 and the data station. Details on
how to use them will be updated.
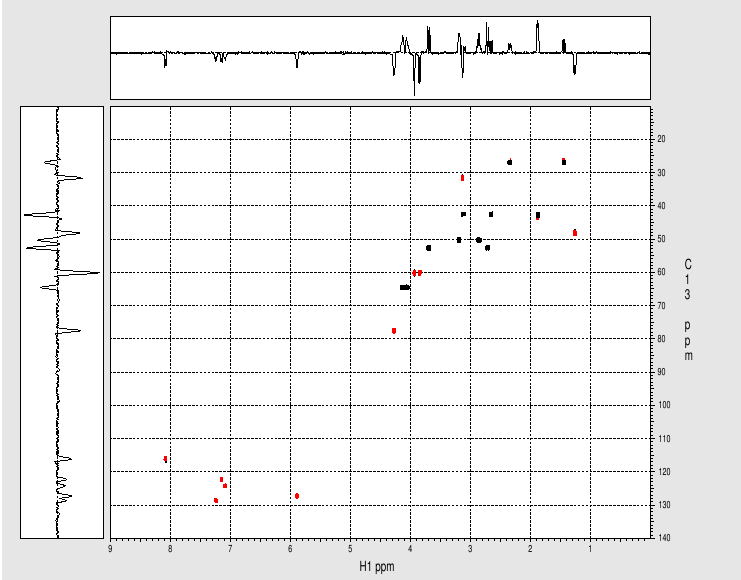
Example spectrum collected on NMR500
- Sample: Strychnine at ~ 25mg/mL (~ 100mM) in
cdcl3
- Data collected October 2010 (~12 mins with nt=2)
- Processed and displayed with nmrPipe/nmrDraw
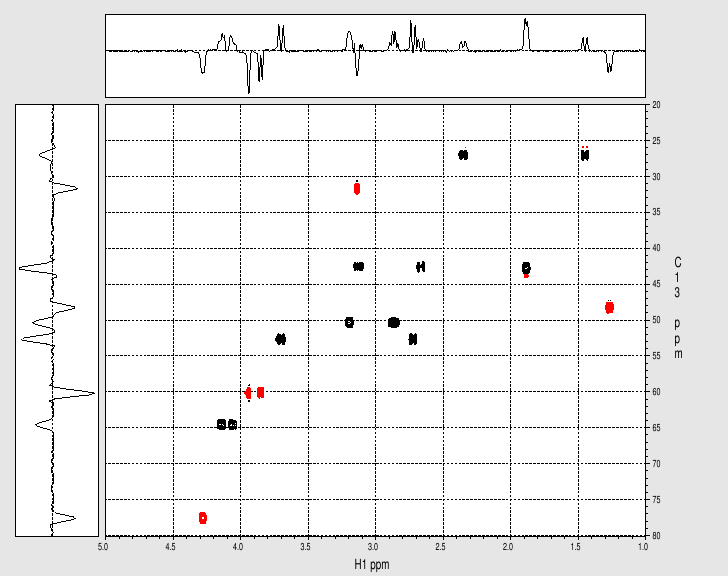
- 1H multiplicity detection turned on: positive (black) peaks -
CH2; negative (red) peaks: CH/CH3
|
Strychnine
|
Expansion of the upper right region:
H.Zhou updated
Oct 2010