2D 1H-1H
NOESY
1D and 2D NOESY
One-dimensional NOESY relies on selective inversion or saturation of one
peak and observing NOE peak at another position. The reliance on selective
pulse reduces the sensitivity of the experiment and limits NOE to one 1H at a
time. Among the versions of 1D NOE experiments, the NOE difference experiment
(noedif or cyclenoe) relies on perfect cancellation of spectra
done with and without 1H saturation, a very demanding quality for any
spectrometer, particularly older ones. Temperature stability, vibration,
hardware instability from scan to scan all contribute artifacts to the
cancellation spectrum. Additionally, through-bond coupling artifacts are not
suppressed, and are often shown as dispersive signals in the final spectrum,
complicating data analysis. NOEDIF or CYCLENOE is NOT the recommended
1D NOESY experiment unless quantitative NOE (% enhancement) is
desired. The recommended, gradient enhanced 1D
NOESY experiment (NOT based on difference and cancellation) is similar to
the 2D experiment shown below, with gradient pulses and zero-quantum
suppression.
Whenever possible, the gradient-based 2D NOESY (~ 30mins) is strongly
recommended. 2D NOESY has the advantage of using hard pulses to excite all
signals at once, more efficient and sensitive. It is also more reliable in
distinguishing real NOE peaks from artifacts because of the automatic crosspeak
symmetry present.
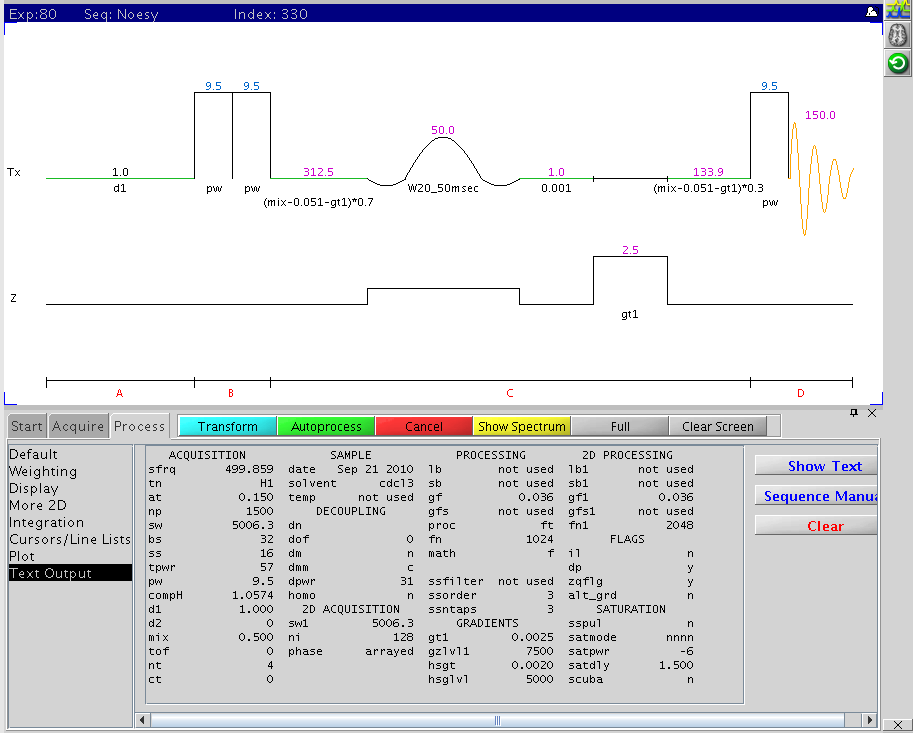
2D Gradient Enhanced NOESY
The following figure is the gradient based 2D NOESY pulse sequence with the
main parameters displayed (NMR500). This sequence uses Z-gradient to crush
zero-quantum (via J-coupling) artifact contribution, often shown as dispersive
peaks. This is the best choice of mordern 2D 1H-1H experiments.
Procedure (on NMR600)
Default means the settiong is already in place by default,
unless changed by a user.
- Lock and shim your sample as usual. Keep lock at ~80% after
shimming by increasing gain or power.
- Find proper sw and tof to use. Note
that the whole signal region must be enclosed in the spectral window.
- Under exp1 (type jexp1 to go
there), collect a standard 1H spectrum with
nt=1, process and reference the spectrum.
Alternatively, you can also load a previous 1H experiment of this sample
and process it.
- Put the box cursor (two cursor lines) to enclose
the signal region and to include ~10% flat baseline area at each end of the
peak region. Type movesw. This command sets a new spectral
width sw and spectrum center tof.
- Run another 1H spectrum with
nt=1 with the new setting. Reference the
spectrum carefully or enter setref.
- Load standard 2D NOESY parameter file
- Type jexp2 to goto exp2. From
exp2, type mf(1,2) to move fid from exp1 to exp2. Type
wft f full to display spectrum. Check and reference
spectrum.
- Type setexp('noesy2d')
su to load standard NOESY parameters. Solvent, and 1H
spectral width and center are copied over from 1D spectrum.
- Enter time to display experiment duration
- Use default parameters values (~20-30 mins experiment) in most cases. The
default number of scans (nt) is 4 and NOE mixing time
(mix) is 0.5 sec. For dilute sample or to get stronger NOE
signals, increase nt or increase mix.
- nt=8 (or 16, 24, ... 4*n)
- mix=1.0 (in most cases, confine
mix to 0.5 to 1.0 sec. Longer mixing time may further
reduce undesired through-bond signals but may bias the NOE accuracy.)
- Type time to check experiment time.
- Type go to collect data.
- Watch for ADC or receiver overflow:
- In arrayed experiments such as 2D's, a fixed
gain (not autogain) must be set. Watch the receiver
overflow light on the VT monitor next to the workstation and the ADC
overflow error message immediately after the experiment starts. The default
(gain=26) works most of the time unless there is an
extremely strong 1H signal in your sample. With a gain above 20, it makes
only small differences.
- If the receiver overflows (red light blinks on
VT display) or ADC overflow message is seen above the command area anytime
during the experiment except during the dummy scan period, it is likely the
data are ruined. Stop the experiment (aa), check the
current gain (gain?) and reduce gain by 2-4 at a time
(gain=22, etc), enter go until the overflow
disappears.
Default parameters
The default setting (modified from Varian's default values) in our parameter
set uses the following for a quick 2D NOESY:
- mix=0.5 (NOESY mixing time is 500msec, sufficient for
most molecules of < 1000 Da)
- ni=128 (128 complex points along indirect dimension)
- d1=1 (recycle delay between scans is 1 sec)
- ss=16 (16 dummy scans before actual data collection)
- nt=4
- phase=1,2 (phase-sensitive, hypercomplex mode in
indirect detection)
- zqflg='y' (turns on zero-quantum signal suppression to
crush through-bond (J) contributed artifacts, often shown as dispersive
signals)
- gain=26 (reduce it by 2-4 at a time if receiver or ADC
overflows)
Data Processing
You can use vnmrJ to process the data, but vnmrJ's graphics display for 2D
spectrum leaves much to be desired. A separate program is strongly recommended
for detailed processing and analysis. Mnova and
nmrPipe/nmrDraw are installed on NMR600 and the data
processing station.
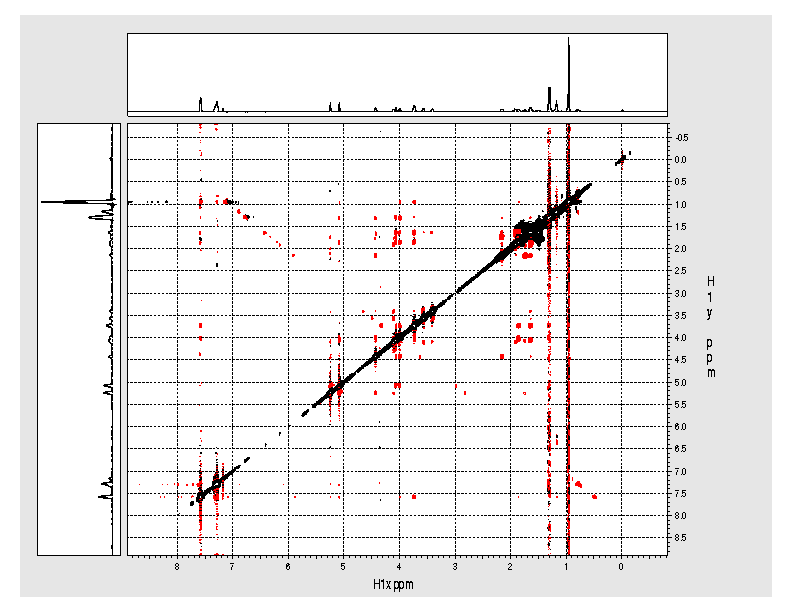
Example spectrum collected on NMR500
- Data collected September 2010 (~30 mins)
- Processed and displayed with nmrPipe/nmrDraw
- NOE crosspeaks are shown as negative (red) peaks. Diagonal peaks are
black.
- Some artifacts are typical. Some are due to the compromise made for a
quick experiment Most can be easily identified.
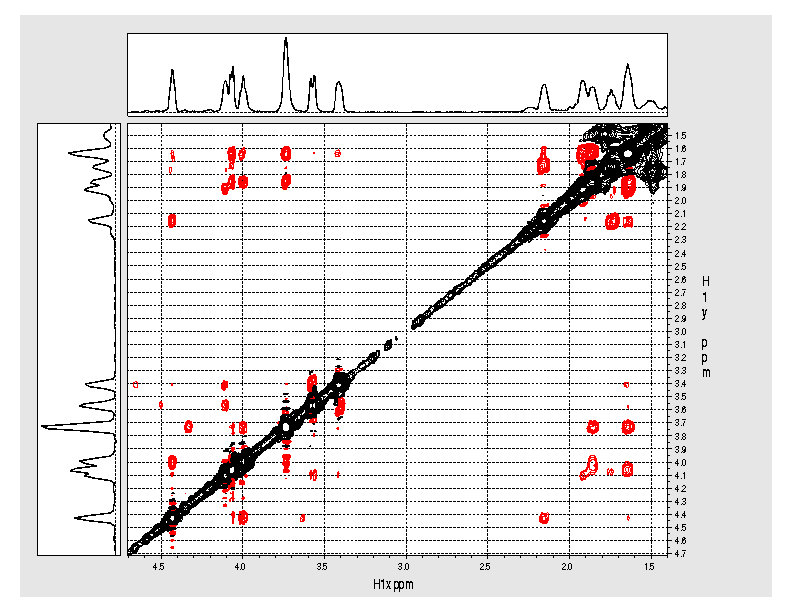
Expansion of
the 1.4ppm to 4.7ppm region
H.Zhou updated
April 2012