It is important to note the difference between steady state NOE and transient NOE measurement. For traditional, quantitative measurement of NOE (as in measurement of molecular dynamics including distance effect), steady-state NOESY experiment using extended selective 1H saturation, such as cyclenoe, must be used. In this experiment, a long on and off resonance saturation period (sattime, >1-3 longest T1 in the molecule) is used for accurate measurement of %NOE in the difference spectrum. During the long saturation period, spins coupled via NOE are able to reach a "steady-state" (equilibrium) which occurs on the time scale of T1. If the saturation and recovery are not set to a few T1, the selective saturation is not enough to create the full NOE and spins are not fully relaxed back to equilibrium before saturation, significant error may contribute to the measured %NOE as the steady-state NOE. The long saturation period required, however, creates other issues (such as hardware stability, selectivity, development of through-bond coupled dispersive signals, etc.) that may contribute to artifacts in the spectrum. For these reasons, cyclenoe is among the trickiest 1D experiments to get a clean difference spectrum if possible at all on certain spectrometers.
The 1D and 2D gradient-selected NOESY experiments are both transient NOESY experiments where NOE is built up during a short mixing period (~0.5 sec) with the spins relaxing along Z-axis. While with careful calibration accurate distance information could be obtained particularly with a NOE buildup curve measurement, they are not meant as an accurate measurement of dynamics and structure with a single experiment. Transient NOE experiments are most effective at determining rough estimate of relative proximity of the proton atoms (typically <5-6A) based on the strength of NOE intensity, appropriate for most structural study. If this is the goal, choose the gradient enhanced NOESY 1D or 2D experiment, not cyclenoe. The recycle delay between scans can be short (~ 1 sec) in these experiments and the artifacts are much smaller than in cyclenoe.
The difference between steady-state NOE and trainsient NOE also lies in the max %NOE attainable. In cyclenoe, max NOE is 50%, compared to max 38% in transient NOE measurement. The two %NOE cannot be directly compared. However, the use of %NOE should be minimzed in general, because its value only has relative meaning in most cases when multiple NOEs originating from the same 1H are compared. In cases when they have to be reported, the details on the measurement must be cited.
One-dimensional NOESY relies on selective inversion or saturation of one peak and observing NOE effect at another position. The reliance on selective pulse reduces the sensitivity of the experiment and limits NOE to one 1H at a time. Additionally, if the peak to be saturated is close to the peak(s) where NOE is expected, the selective NOESY experiment will not work well. Among the versions of 1D NOE experiments, the NOE difference experiment, noedif or cyclenoe, relies on perfect cancellation of most signals, done with on and off-resonance 1H saturation, to reveal the NOE coupled signals. This is very demanding quality for any spectrometer, particularly older ones. Temperature fluctuation, vibration, and hardware instability from scan to scan all contribute artifacts to the cancellation spectrum. Additionally, through-bond coupling artifacts are not suppressed, and are often shown as dispersive signals in the final spectrum, complicating data analysis. Noedif or cyclenoe is NOT the recommended 1D NOESY experiment unless traditional steady-state, quantitative NOE (% enhancement) is desired. The recommended 1D NOE experiment for 1H proximity estimate is the gradient enhanced sequence with zero-quantum (through-bond) signal suppression.
Whenever possible, however, the gradient-based 2D NOESY (~ 30mins) is recommended. 2D NOESY has the advantage of using hard pulses to excite all signals at once, more efficient and sensitive. It is also more reliable in distinguishing real NOE peaks from artifacts because of the automatic crosspeak symmetry present.
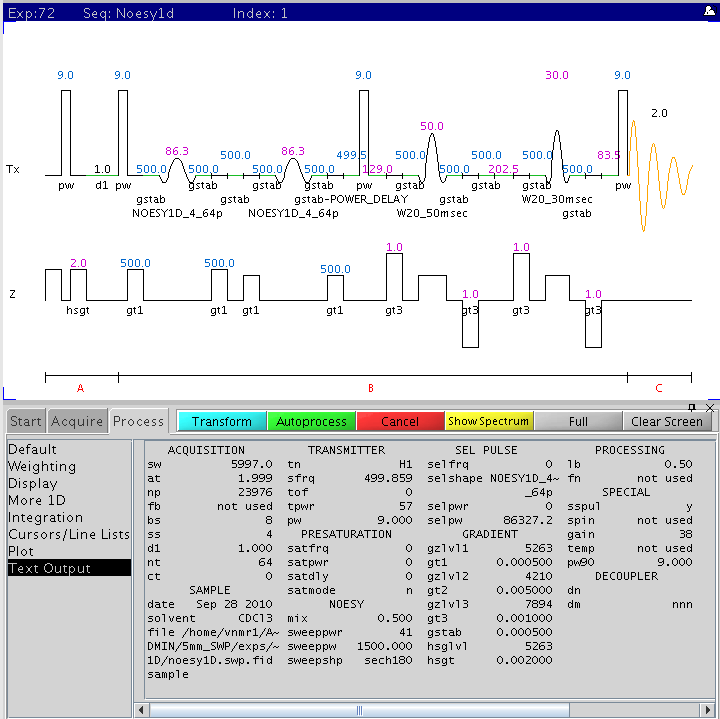
The following figure is the gradient based 1D NOESY pulse sequence with the main parameters displayed (NMR500). This sequence uses Z-gradient to crush zero-quantum (via J-coupling) artifact contribution, often shown as dispersive peaks. This is the best choice of modern 1D NOESY experiments. Central to this pulse sequence is a Double Pulsed Field Gradient Spin Echo (DPFGSE) used to give a cleaner spectrum. Often, this sequence is refered to as DPFGSE NOESY.
Note: If an error is made during the peak selection or for other reason, start from the mf(1,2) step. Do not re-type wft after loading the NOESY parameters because another wft will reset the current parameter set into the ones used to collect the reference 1H spectrum.
Default parameters
The default setting (modified from Varian's default values) in our parameter set uses the following for a quick 2D NOESY:
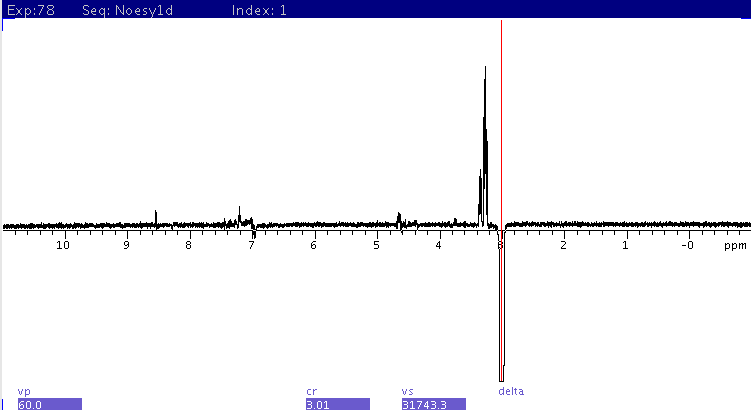
Type wft to process data. There should be one intense peak coming from the selected/excited resonance(s). Phase this signal to a negative peak. The NOE peaks should be mostly positive for small molecules. Small dispersive signals are mostly from through-bond correlation, left-over from imperfect zero-quantum suppression.
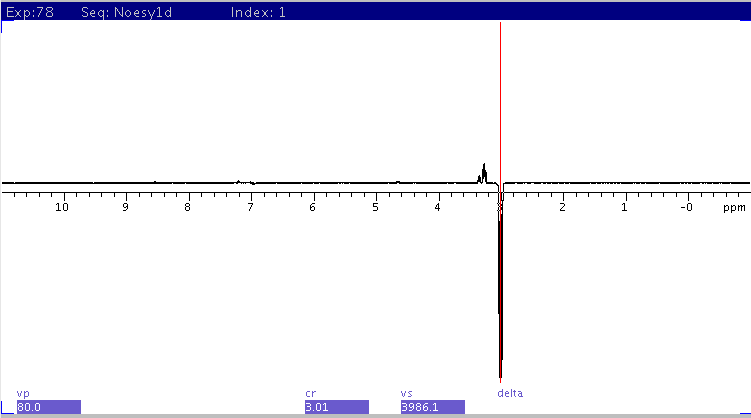
Same spectrum as above excitation peak scaled to fit window.
H.Zhou updated 10/2010