1H
Homonuclear Decoupling
The traditional homonuclear decoupling experiment is done with weak,
selective decoupling (homonuclear decoupling) of one or a
group of protons. Observation of the collapse of 1H fine splitting enables
identification of through-bond coupled protons. This is an easy and quick
experiment if only a few coupled partners are studied. Each coupling is studied
separately with an on-resonance decoupling of one partner or separately both
partners for the sake of symmetry, reducing its efficiency if many such
couplings are examined. A majority of such studies can be done nowdays with 2D
COSY-type experiments (such as gcosy) which allow
simultaneous observation of all through-bond couplings in less time. However, a
unique adavantage of this experiemnt is to offer clarity to a crowed 1H
spectrum with complicated J-coupling splittings at a high resolution, or to
quickly confirm a few well-guessed couplings.
To perform the homonuclear decoupling experiment (homodec
sequence on the Varian systems), the user should pay attention to the
following:
- Decoupling power must be weak so that it is selective in order to
minimize excitation of adjacent peaks which may lead to misinterpretation.
- The 1H decoupling power level (dpwr), however has to be
strong enough to cause clear visible effect to coupled partners. This means
the power level may have to be re-adjusted during the experiment in order
to get a clean-cut effect on the coupled partner peak(s).
- Be very cautious when raising the power level for a long
acquisition period with decoupling; the probe may be burned if the
power is too high (see procedure below). A limitation is set to 20dB on
nmr500 for this experiment. The recycle delay must be long enough (>1
sec) for the probe to cool in between scans.
- Coupled peaks that are close to each other may be difficult to study with
this experiment.
- Homonuclear decoupling introduces a glitch, often as an out-of-phase
peak, at the position of selective decoupling.
The 2D COSY experiment (gcosy) does not have any of the
issues mentioned above. Linewidth, however, in gcosy is
usually broader because of the use of short acquisition time and the
absolute-value mode, but it is mostly sufficient and the peaks can be sharper
if needed with longer at.
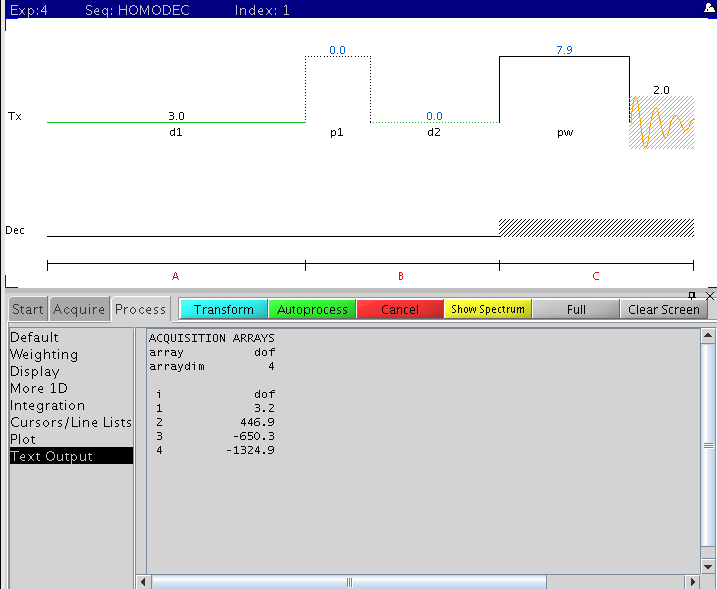
Homodec
Pulse sequence and example reference (1st) and 3 selective decoupling offset
frequencies (dof).
Procedure (on nmr500)
Step 1: Preparation
Step 2: Collect 1H spectrum
- Collect a standard 1H spectrum with nt=1 (or
nt=4 for cleaner spectrum)
- Put the box cursor to enclose the signal region and to include ~10% flat
baseline area at both ends of the signal region. Type
movesw . This sets a new spectral width
sw and spectrum center tof .
- Collect another 1H spectrum with nt=1 with the new
setting. Phase and reference the spectrum carefully.
Step 3: Set up array for decoupling frequency offset
(dof)
- Join exp2 (or another experiment #) with jexp2. Type
mf(1,2) to move FID from exp1 to exp2. Type wft f
full to display spectrum.
- Type setexp('homodec')
- Type ds to display spectrum. Place cursor in a clean
baseline area away from peaks. Keep cursor away from spectrum edges
(>0.5ppm). Type sd. This sets the reference decoupling
position (1st element in array).
- Place cursor centered at a peak or a group of split peaks to be studied
and type sda. Repeat this step through all peaks to be
studied.
- Type da to display the dof array in
Process->Textoutput window. Make sure you have the
right number of array elements (reference + peaks to be decoupled).
- If a mistake is made during setting dof array, start
from setting reference spectrum with sd command.
Step 4: Set nt and submit experiment
- Based on the signal strength of the 1H spectrum, set proper,
equivalent nt.
- decoupling power dpwr is set to 5 by default. If the
peak to be decoupled is narrow, set it lower (ie. dpwr=0, minimum is -16) if higher selectivity is
needed. For broader peaks, set dpwr up to 20. Do not use
more than 20 for dpwr.
- Type go to start experiment.
Step 5: Processing
- As in most experiments, click Process->Autoprocess to
use vnmrJ's autoprocessing feature during or after experiment.
For manual processing:
- After the 1st array element (reference) is done, type wft aph f
full. Manually adjust phase if necessary.
- Type dssa dscale to show arrayed
spectra vertically. Type vs=vs*0.5 dssa dscale to shrink
peaks by half.
- To zoom in a region, type ds(1) f full and expand region
of the 1st spectrum. Type dssa to display array
- To display any one of the arrayed spectra, type ds(#) f
full where # is the index number of the element (1,2, 3 ..
etc.)
Default Parameters
- at=2 (2 sec acquisition time)
- d1=3 (3 sec recycle delay, minimum set to 1 sec)
- dpwr=5 (5 dB decoupling power. Max is set to 20.
Reduce to 0 or down to minimum -16 if higher selectivity is needed)
- nt=4 (4 scans)
Example
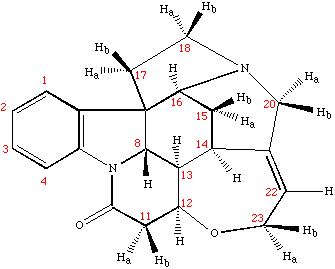
Sample: Strychnine at ~ 25mg/mL (~ 100mM) in cdcl3
- Data collected November 2010 (~ 4 mins with nt=8)
|
 |
gcosy
spectrum (20 mins)
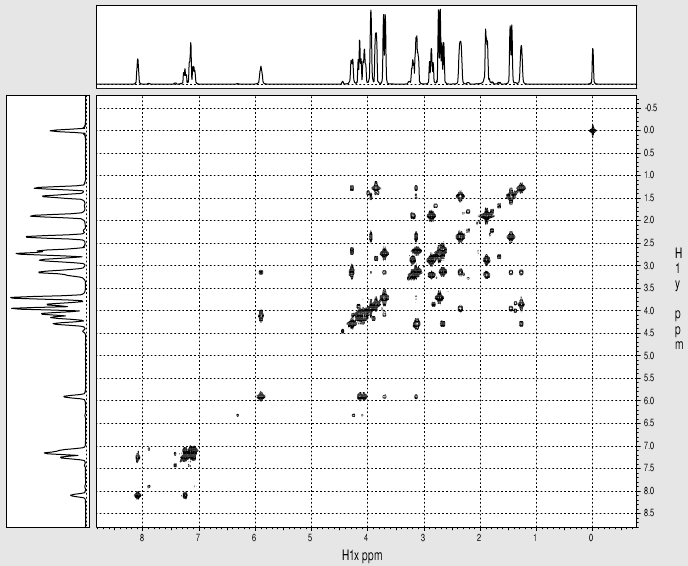
|
Homodec
Spectra (compare with gcosy spectrum above)
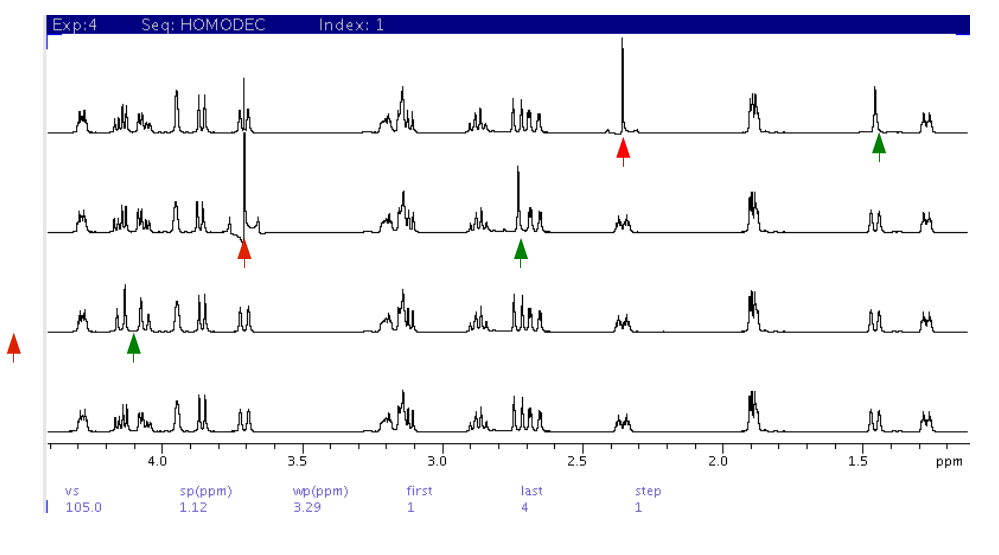
- The
bottom spectrum is the reference with decoupling at 5ppm. The red
arrows indicate decoupling at peak positions of ~5.9ppm, 3.7ppm,
and 2.35ppm from bottom to top. The green arrows indicate the
collapse of J-coupled partner peaks into decoupled peaks.
- A glitch
peak (often out of phase) at the decoupling position (red arrow)
often appears in the spectrum.
|
H. Zhou
updated Nov 2010